import matplotlib.pyplot as plt
import networkx as nx
def plot_computation_dag(all_nodes, x1, x2):
# ----- nodes & layers -----
inputs = ['x1', 'x2']
params = ['theta_0', 'theta_1', 'theta_2']
interms = ['f1','f2','f3','f4','f5','f6','f7','f8','f9']
loss_node = ['L']
layers = {
0: ['theta_1','x1','theta_2','x2','theta_0'],
1: ['f1','f2'],
2: ['f3'],
3: ['f4'],
4: ['f5'],
5: ['f6'],
6: ['f7'],
7: ['f8'],
8: ['f9'],
9: ['L'],
}
# ----- edges (producer -> consumer) -----
edges = [
('theta_1','f1'), ('x1','f1'),
('theta_2','f2'), ('x2','f2'),
('f1','f3'), ('f2','f3'),
('f3','f4'), ('theta_0','f4'),
('f4','f5'),
('f5','f6'),
('f6','f7'),
('f7','f8'),
('f8','f9'),
('f9','L'),
]
# Build graph
G = nx.DiGraph()
G.add_nodes_from(inputs + params + interms + loss_node)
G.add_edges_from(edges)
# Positions: grid by layers
pos = {}
for lx, nodes in layers.items():
n = len(nodes)
ys = list(range(n))
# center vertically
ys = [y - (n-1)/2 for y in ys]
for i, name in enumerate(nodes):
pos[name] = (lx, ys[i])
# Node colors
color_map = {}
for n in G.nodes:
if n in params: color_map[n] = '#88CCEE' # params
elif n in inputs: color_map[n] = '#CCCCCC' # inputs
elif n in loss_node: color_map[n] = '#EE6677' # loss
else: color_map[n] = '#CCEECC' # interms
node_colors = [color_map[n] for n in G.nodes]
# Labels with value and grad (if available)
def node_val(name):
if name in ['x1','x2']:
return float(x1.item()) if name=='x1' else float(x2.item())
return float(all_nodes[name].item())
def node_grad(name):
if name in ['x1','x2']: return None
g = all_nodes[name].grad
return None if g is None else float(g.item())
labels = {}
for n in G.nodes:
val = node_val(n)
g = node_grad(n)
if g is None:
labels[n] = f"{n}\nval={val:.4f}"
else:
labels[n] = f"{n}\nval={val:.4f}\ngrad={g:.4f}"
# Draw
plt.figure(figsize=(20,10))
nx.draw_networkx_edges(G, pos, arrows=True, arrowstyle='-|>', arrowsize=16, width=1.8)
nx.draw_networkx_nodes(G, pos, node_color=node_colors, node_size=6500, edgecolors='black', linewidths=0.8)
nx.draw_networkx_labels(G, pos, labels=labels, font_size=9)
plt.axis('off')
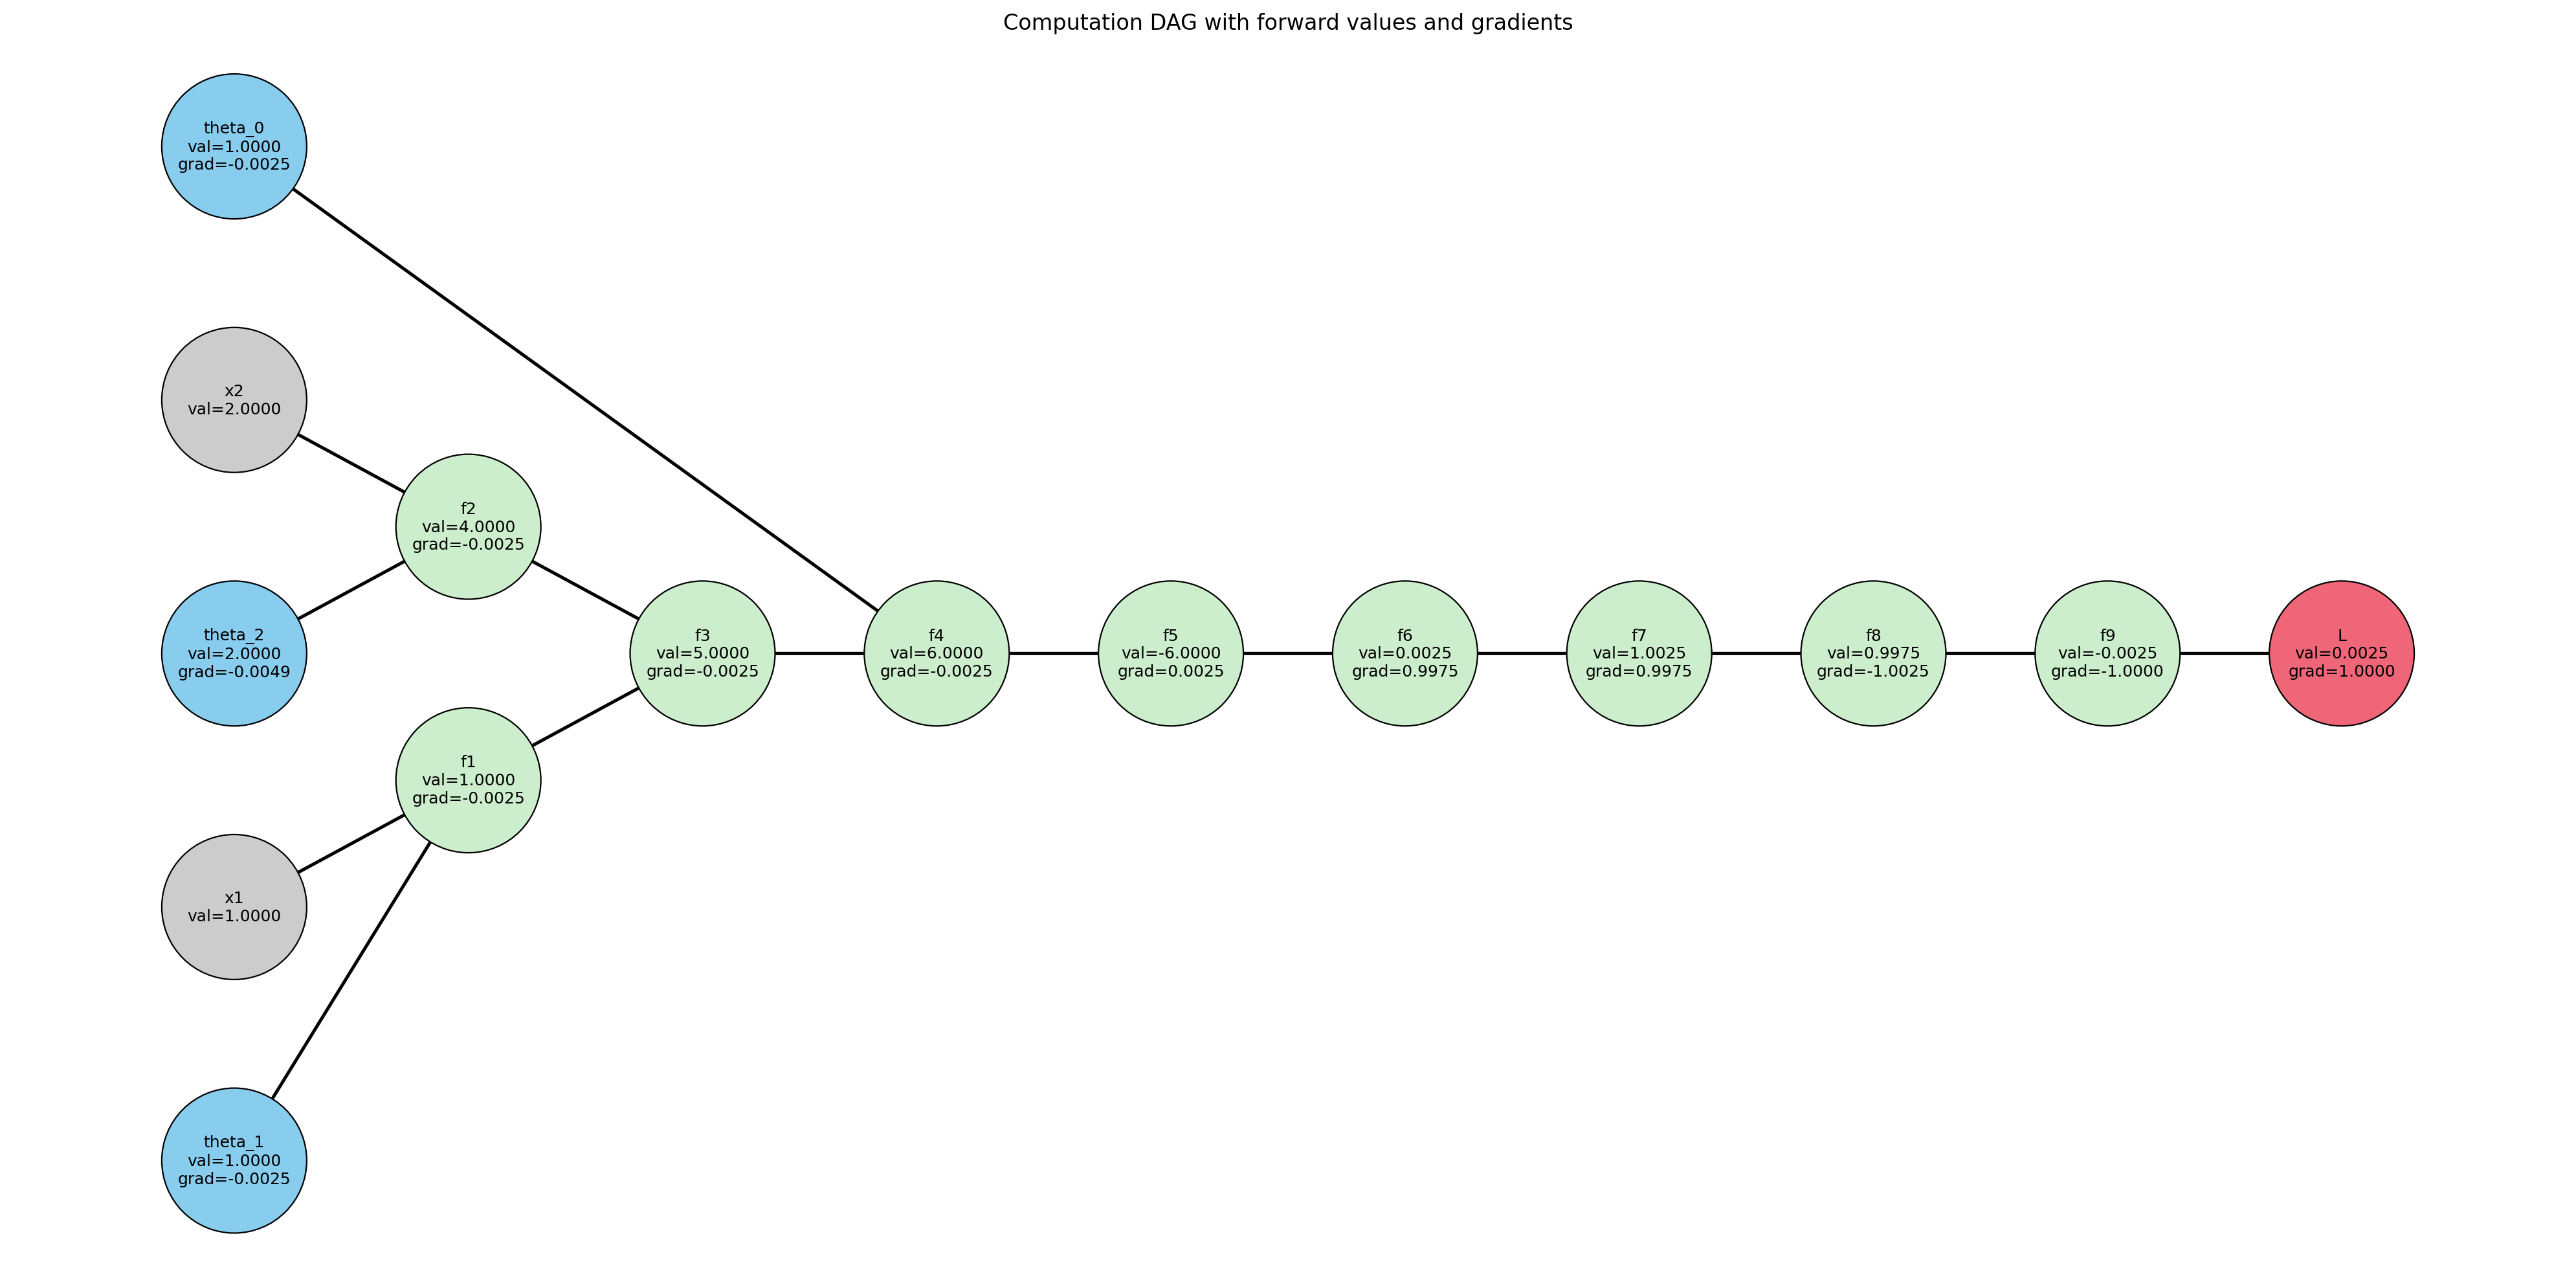
plt.title("Computation DAG with forward values and gradients")
plt.tight_layout()
plot_computation_dag(all_nodes, x1, x2)