import numpy as np
import matplotlib.pyplot as pltBinomial
Interactive tutorial on binomial with practical implementations and visualizations
![]()
SPINE_COLOR = 'gray'

def format_axes(ax):

    for spine in ['top', 'right']:
        ax.spines[spine].set_visible(False)

    for spine in ['left', 'bottom']:
        ax.spines[spine].set_color(SPINE_COLOR)
        ax.spines[spine].set_linewidth(0.5)

    ax.xaxis.set_ticks_position('bottom')
    ax.yaxis.set_ticks_position('left')

    for axis in [ax.xaxis, ax.yaxis]:
        axis.set_tick_params(direction='out', color=SPINE_COLOR)

    return ax
def bino(n, p, k) choose(n, k) * p**k * (1-p)**(n-k)stats.binom.pmf(n=21, p=0.3, k=4)0.11277578372328753from scipy import stats
a=range(21)
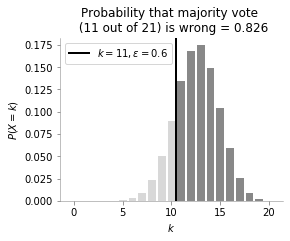
for error in [0.3, 0.6]:
fig, ax = plt.subplots(figsize=(4,3))
ax.bar(a,stats.binom.pmf(n=21, p=error, k=a), color='grey', alpha=0.3)
ax.bar(a[11:],stats.binom.pmf(n=21, p=error, k=a[11:]), color='grey', alpha=0.9)
ax.set_ylabel(r'$P(X=k)$')
ax.set_xlabel(r'$k$')
#ax.set_ylim((0,0.4))
#ax.legend()
format_axes(ax)
#plt.fill_betweenx(3, 11, 20)
plt.axvline(10.5, color='k',lw=2, label=r'$k=11, \epsilon={}$'.format(error))
plt.title("Probability that majority vote \n (11 out of 21) is wrong = {}".format(sum(stats.binom.pmf(n=21, p=error, k=a[11:])).round(3)))
plt.legend()
import tikzplotlib
tikzplotlib.save("test-{}.tex".format(error), )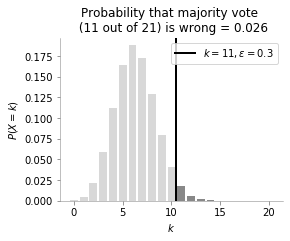
!cat test.tex% This file was created by tikzplotlib v0.9.0.
\begin{tikzpicture}
\definecolor{color0}{rgb}{0.12156862745098,0.466666666666667,0.705882352941177}
\begin{axis}[
tick align=outside,
tick pos=left,
title={Simple plot \(\displaystyle \frac{\alpha}{2}\)},
x grid style={white!69.0196078431373!black},
xlabel={time (s)},
xmin=-0.75, xmax=15.75,
xtick style={color=black},
y grid style={white!69.0196078431373!black},
ylabel={Voltage (mV)},
ymin=0, ymax=0.24892,
ytick style={color=black}
]
\draw[draw=none,fill=color0] (axis cs:0,0) rectangle (axis cs:1.5,0.00293333333333333);
\draw[draw=none,fill=color0] (axis cs:1.5,0) rectangle (axis cs:3,0.0157333333333333);
\draw[draw=none,fill=color0] (axis cs:3,0) rectangle (axis cs:4.5,0.110866666666667);
\draw[draw=none,fill=color0] (axis cs:4.5,0) rectangle (axis cs:6,0.116866666666667);
\draw[draw=none,fill=color0] (axis cs:6,0) rectangle (axis cs:7.5,0.237066666666667);
\draw[draw=none,fill=color0] (axis cs:7.5,0) rectangle (axis cs:9,0.0889333333333333);
\draw[draw=none,fill=color0] (axis cs:9,0) rectangle (axis cs:10.5,0.0760666666666667);
\draw[draw=none,fill=color0] (axis cs:10.5,0) rectangle (axis cs:12,0.012);
\draw[draw=none,fill=color0] (axis cs:12,0) rectangle (axis cs:13.5,0.00593333333333333);
\draw[draw=none,fill=color0] (axis cs:13.5,0) rectangle (axis cs:15,0.000266666666666667);
\end{axis}
\end{tikzpicture}sum(stats.binom.pmf(n=21, p=error, k=a[11:])).round(2)0.83