import numpy as np
import matplotlib
import matplotlib.pyplot as plt
%matplotlib inline

from math import sqrt
SPINE_COLOR = 'gray'Boosting Explanation
Interactive tutorial on boosting explanation with practical implementations and visualizations
![]()
x = np.linspace(0.04, 0.51, 1000)def latexify(fig_width=None, fig_height=None, columns=1):
"""Set up matplotlib's RC params for LaTeX plotting.
Call this before plotting a figure.
Parameters
----------
fig_width : float, optional, inches
fig_height : float, optional, inches
columns : {1, 2}
"""
# code adapted from http://www.scipy.org/Cookbook/Matplotlib/LaTeX_Examples
# Width and max height in inches for IEEE journals taken from
# computer.org/cms/Computer.org/Journal%20templates/transactions_art_guide.pdf
assert(columns in [1,2])
if fig_width is None:
fig_width = 3.39 if columns==1 else 6.9 # width in inches
if fig_height is None:
golden_mean = (sqrt(5)-1.0)/2.0 # Aesthetic ratio
fig_height = fig_width*golden_mean # height in inches
MAX_HEIGHT_INCHES = 8.0
if fig_height > MAX_HEIGHT_INCHES:
print("WARNING: fig_height too large:" + fig_height +
"so will reduce to" + MAX_HEIGHT_INCHES + "inches.")
fig_height = MAX_HEIGHT_INCHES
params = {'backend': 'ps',
'axes.labelsize': 8, # fontsize for x and y labels (was 10)
'axes.titlesize': 8,
'legend.fontsize': 8, # was 10
'xtick.labelsize': 8,
'ytick.labelsize': 8,
'text.usetex': True,
'figure.figsize': [fig_width,fig_height],
'font.family': 'serif'
}
matplotlib.rcParams.update(params)
def format_axes(ax):
for spine in ['top', 'right']:
ax.spines[spine].set_visible(False)
for spine in ['left', 'bottom']:
ax.spines[spine].set_color(SPINE_COLOR)
ax.spines[spine].set_linewidth(0.5)
ax.xaxis.set_ticks_position('bottom')
ax.yaxis.set_ticks_position('left')
for axis in [ax.xaxis, ax.yaxis]:
axis.set_tick_params(direction='out', color=SPINE_COLOR)
return axplt.plot(x, 0.5*np.log((1-x)/x), color='k', linewidth=3)
plt.axvline(0.5, color='r', linewidth=0.9)
plt.axhline(0.0, color='r', linewidth=0.9)
plt.xlabel(r"$err_m$")
plt.ylabel(r"$\alpha_m$")Text(0, 0.5, '$\\alpha_m$')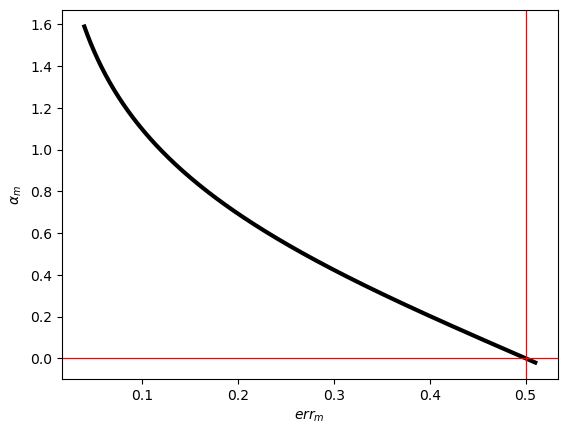
latexify()
plt.rcParams.update({'font.size': 40})
plt.plot(x, 0.5*np.log((1-x)/x), color='k', linewidth=2)
plt.axvline(0.5, color='r', linewidth=0.9)
plt.axhline(0.0, color='r', linewidth=0.9)
plt.xlabel(r"$err_m$")
plt.ylabel(r"$\alpha_m$")
format_axes(plt.gca())
plt.savefig("../supervised/assets/ensemble/figures/alpha-boosting.pdf", bbox_inches="tight", transparent=True)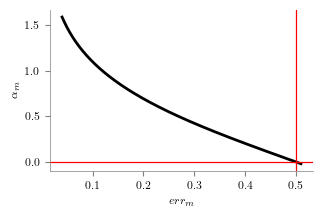
latexify()
plt.rcParams.update({'font.size': 40})
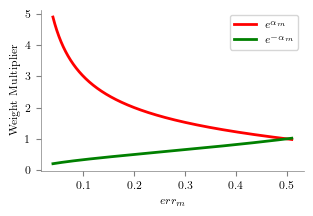
plt.plot(x, np.exp(0.5*np.log((1-x)/x)), color='r', linewidth=2, label=r'$e^{\alpha_m}$ ')
plt.plot(x, np.exp(-0.5*np.log((1-x)/x)), color='g', linewidth=2, label=r'$e^{-\alpha_m}$')
plt.xlabel(r"$err_m$")
plt.ylabel("Weight Multiplier")
format_axes(plt.gca())
plt.legend()
plt.savefig("../supervised/assets/ensemble/figures/alpha-boosting-weight.pdf", bbox_inches="tight", transparent=True)