# Repeat the above process as a function to visualize the convolution outputs for any image for any layer
def scale_img(img):
"""
Scale the image to the same scale
"""
img = img - img.min()
img = img / img.max()
return img
def visualize_conv_output(model, img):
"""
Visualize the output of a convolutional layer
"""
# Get output from model's first conv1 layer
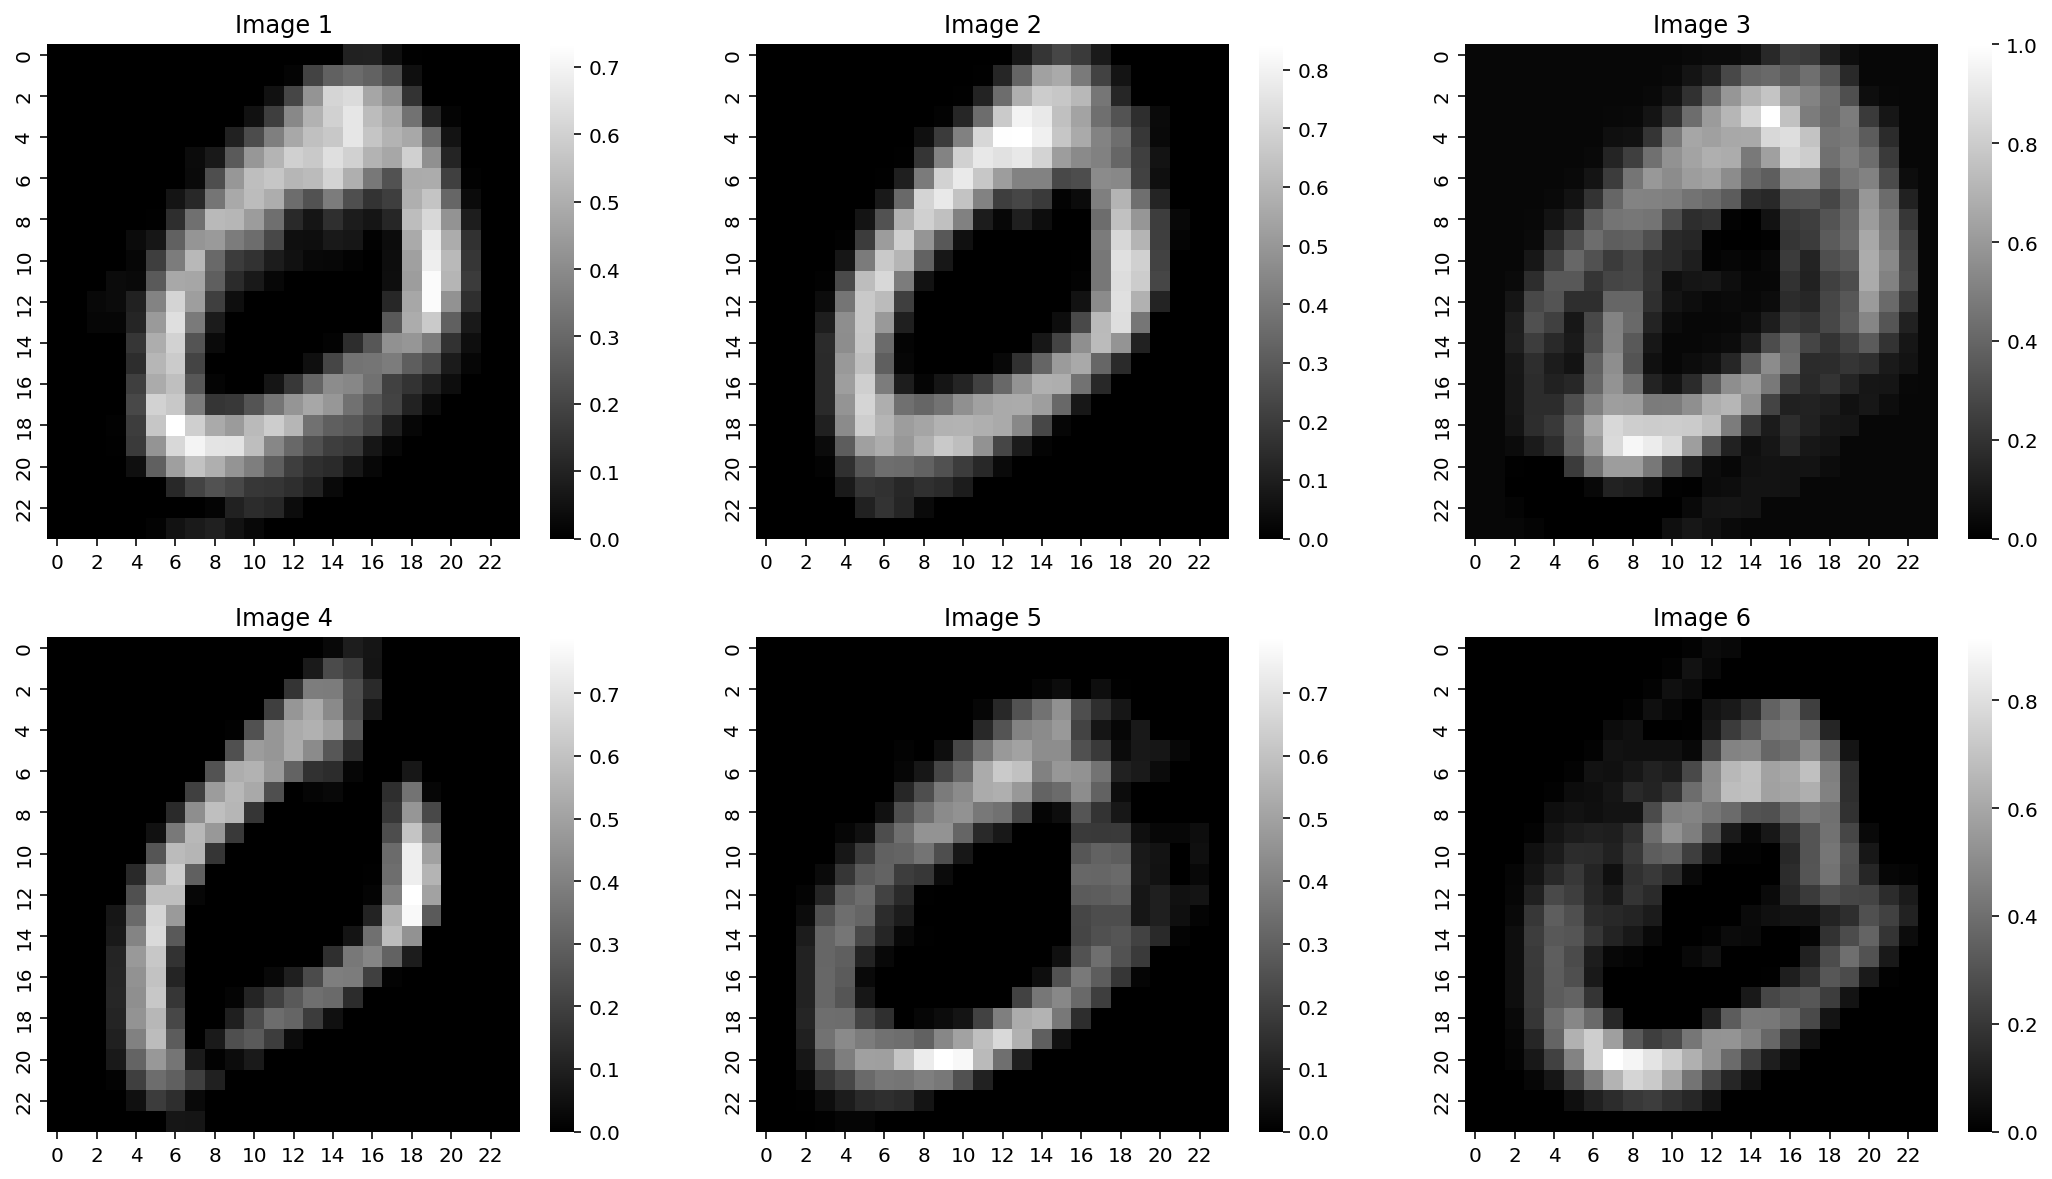
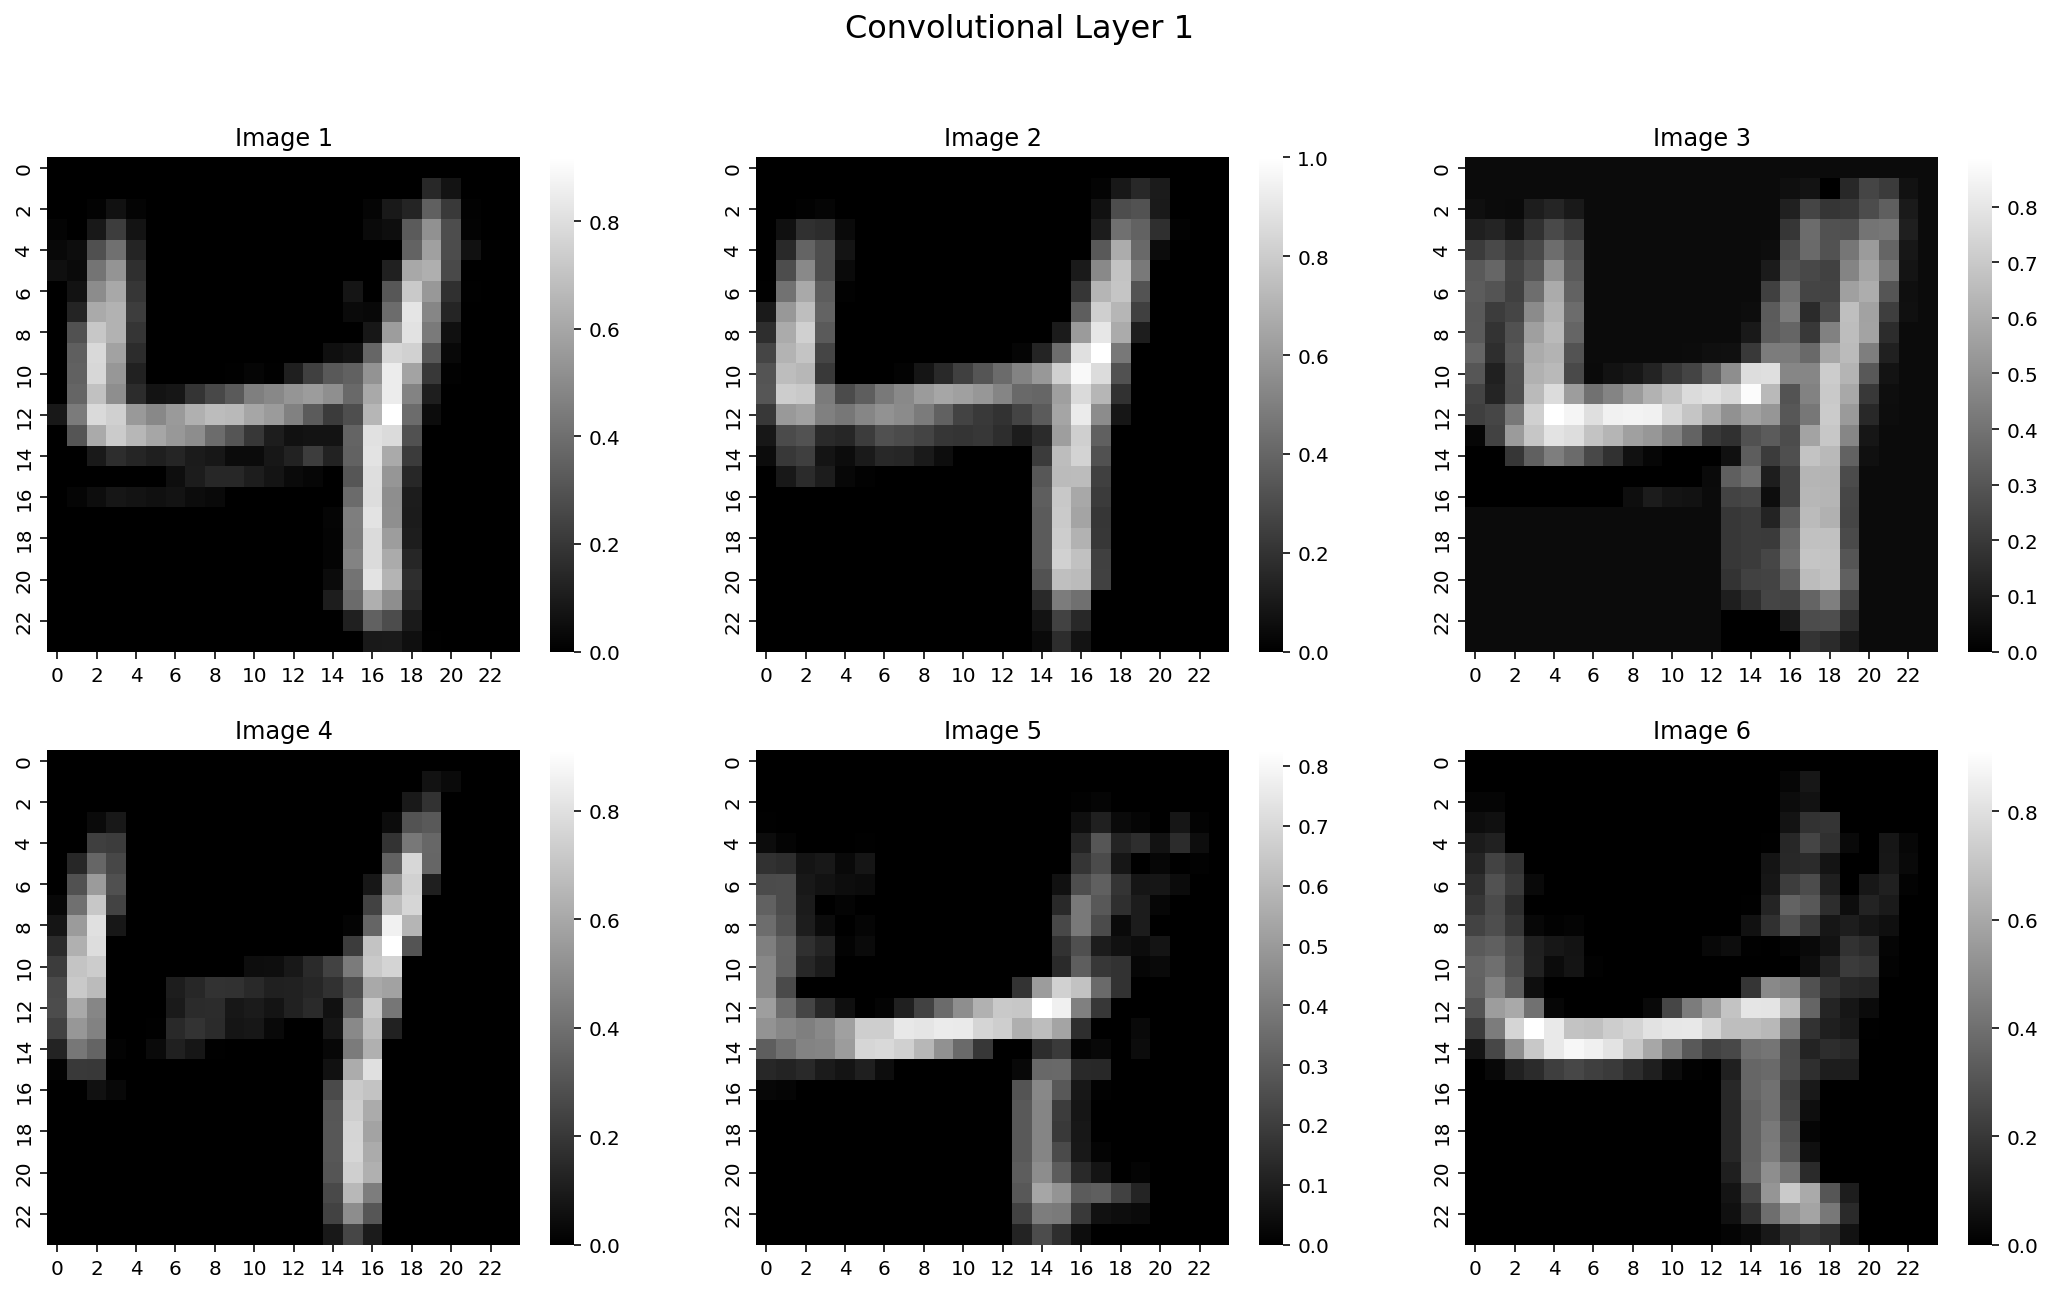
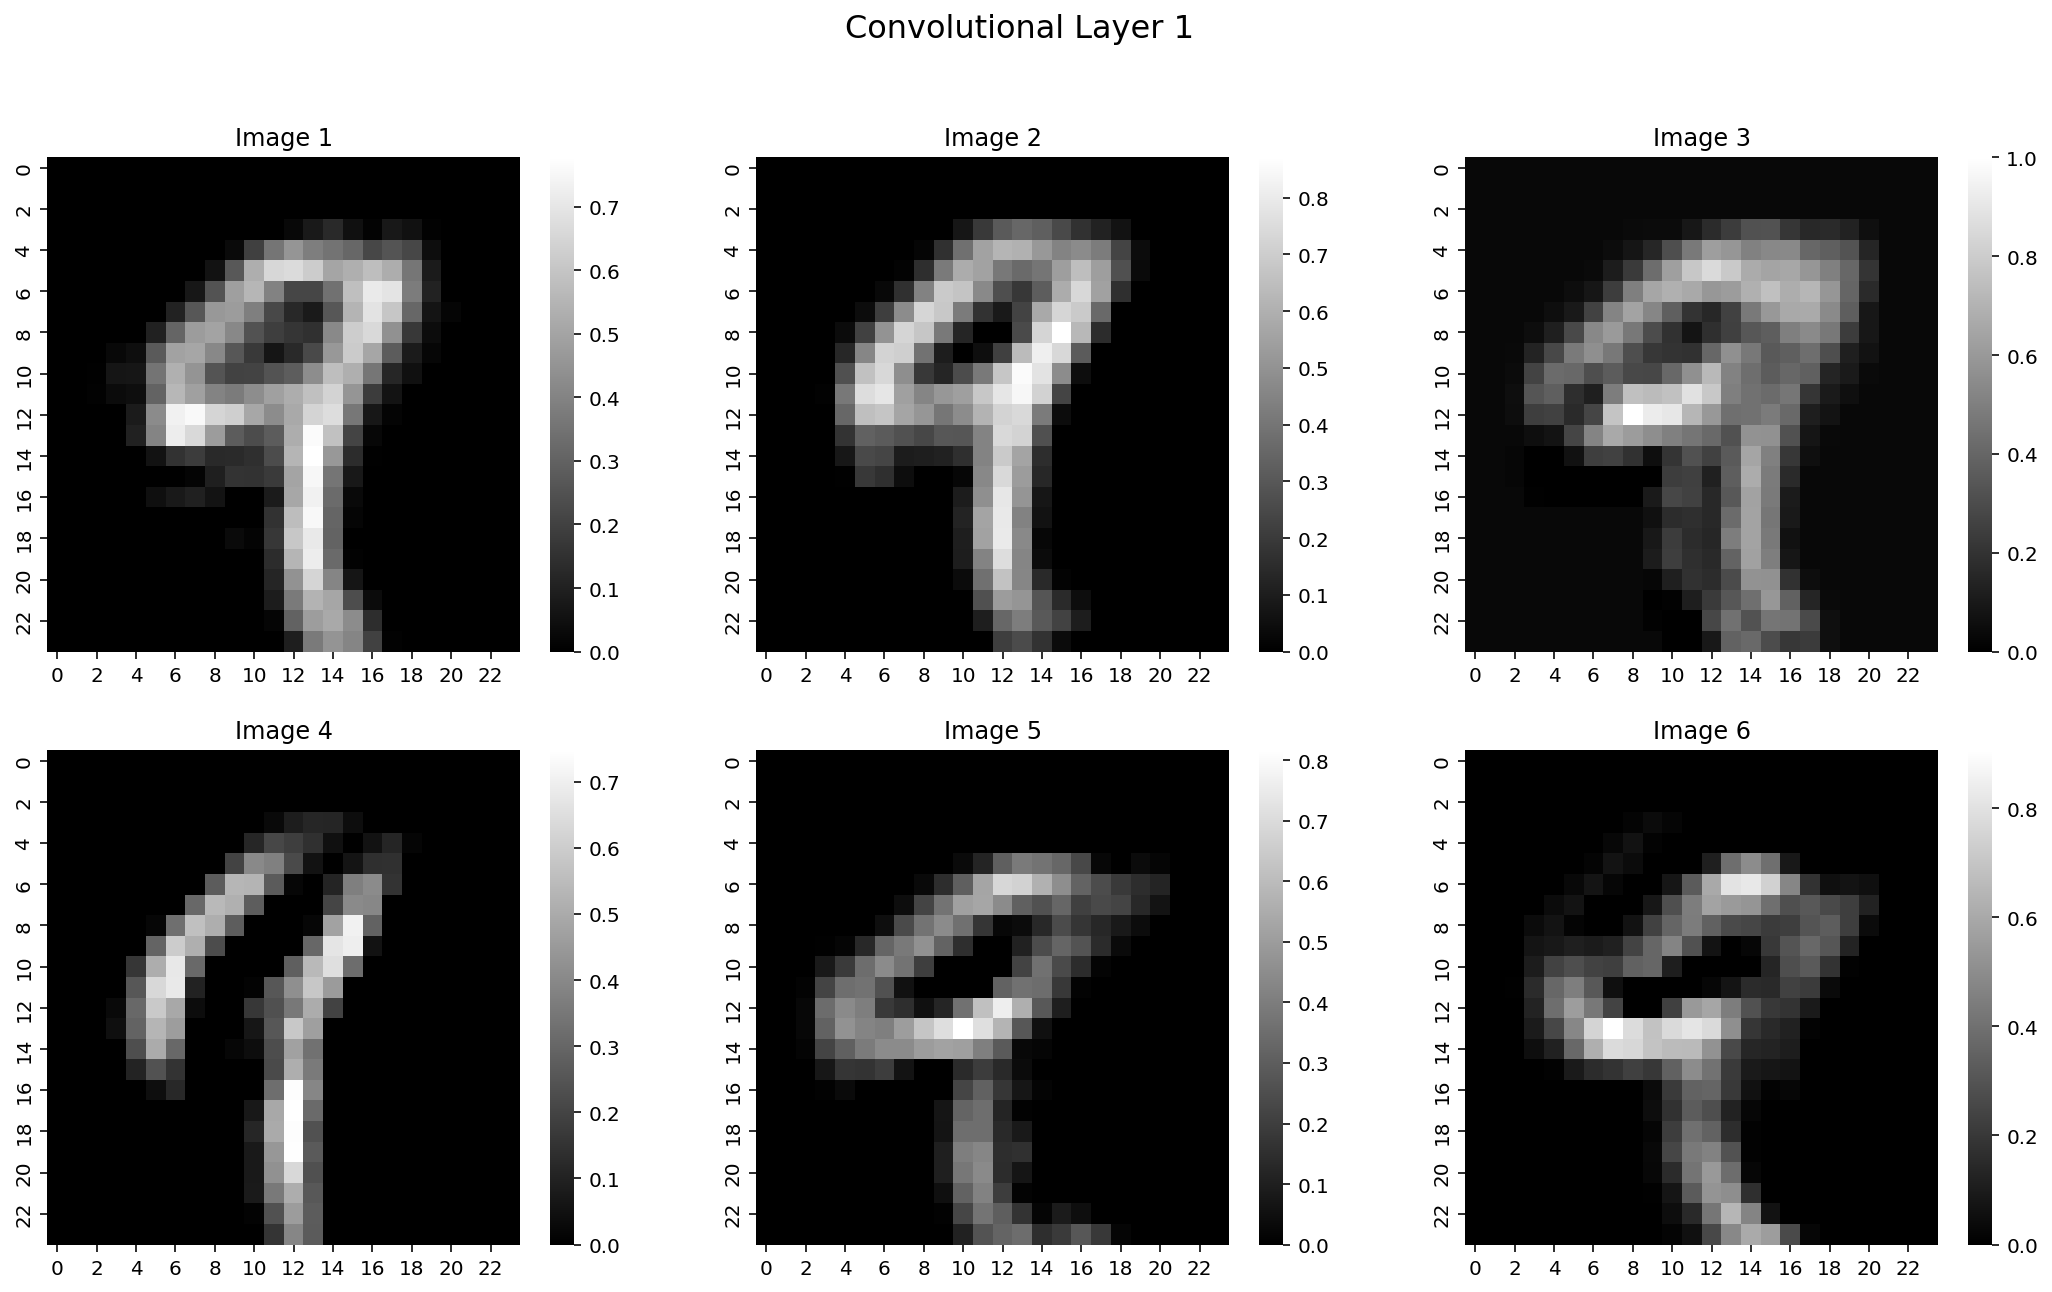
conv1 = F.relu(model.conv1(img))
# For plotting bring all the images to the same scale
c1 = scale_img(conv1)
# Visualizae the output of the first convolutional layer

fig, axes = plt.subplots(2, 3, figsize=(18, 10))
ax = axes.ravel()

for i in range(6):
    sns.heatmap(c1[0][i].detach().numpy(), ax=ax[i], cmap='gray')
    ax[i].set_title('Image {}'.format(i+1))
# Add title to the figure
fig.suptitle('Convolutional Layer 1', fontsize=16)
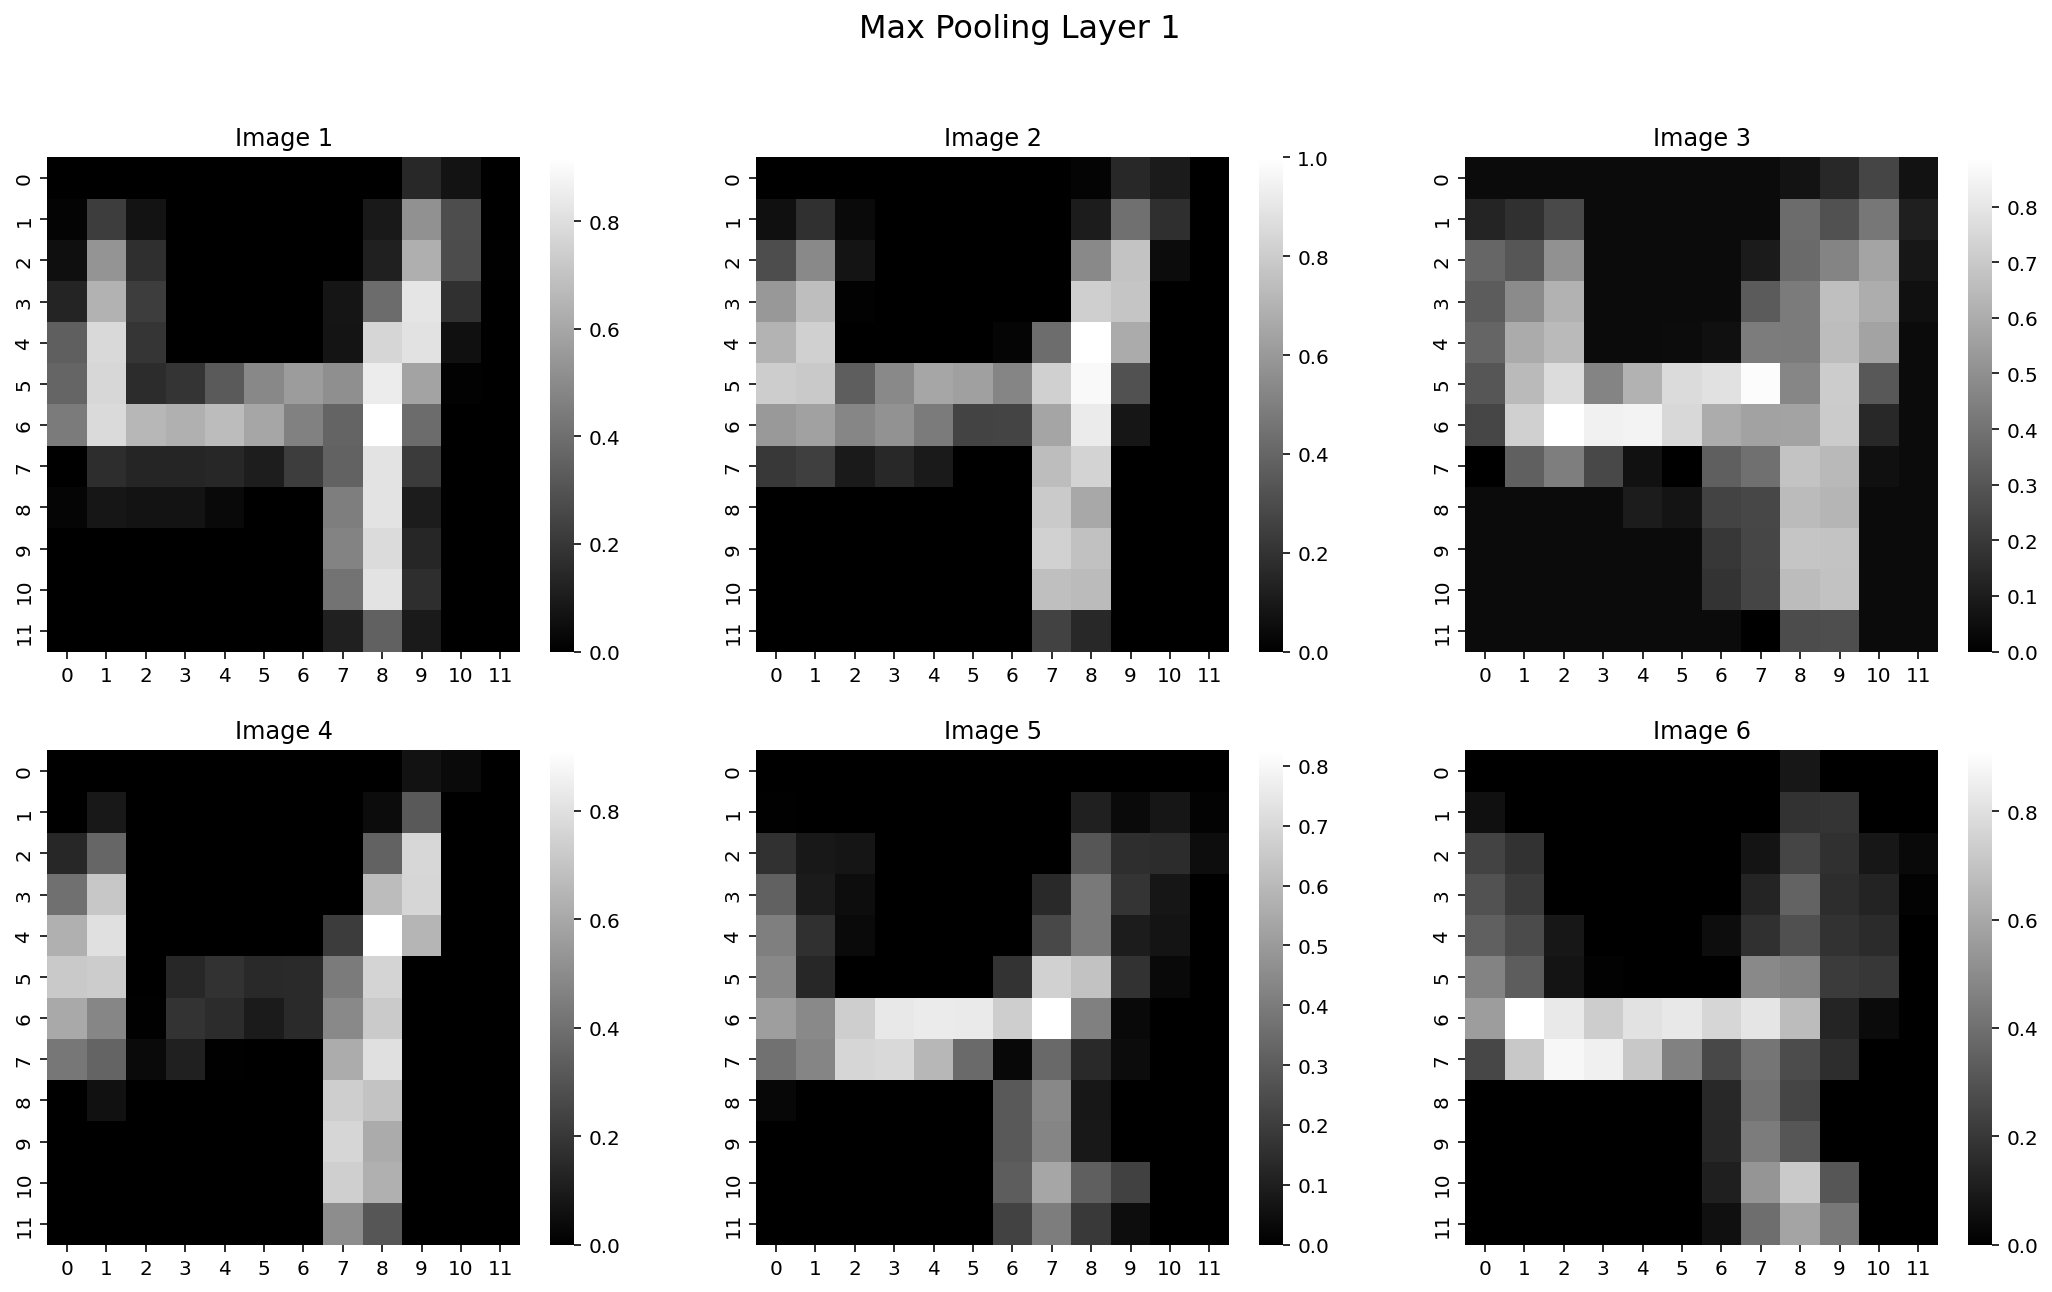
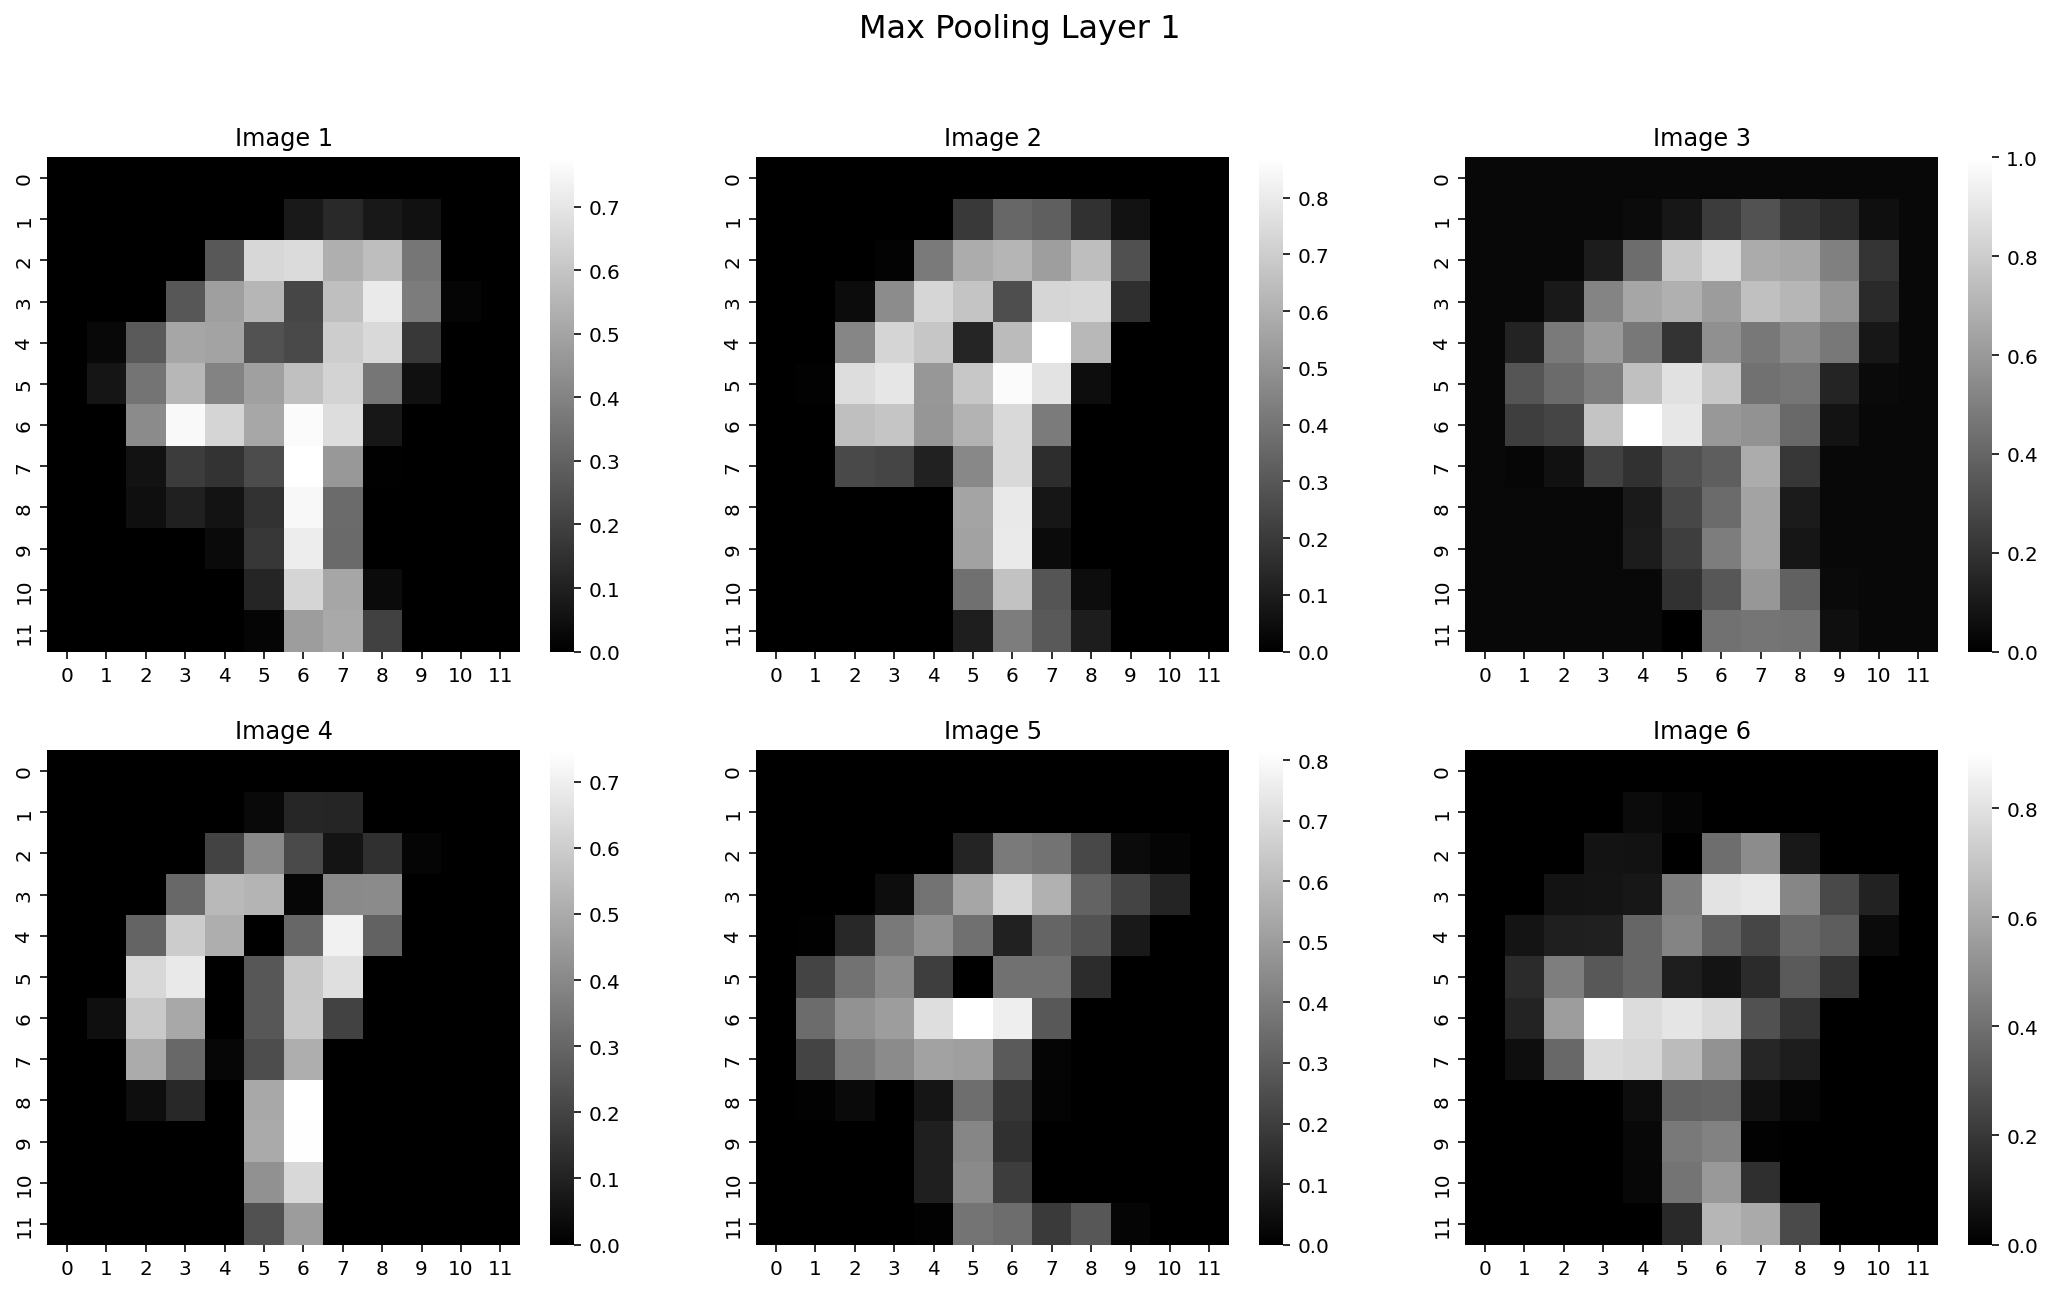
# Get output from model after max pooling
pool1 = F.max_pool2d(conv1, 2)
# For plotting bring all the images to the same scale
p1 = scale_img(pool1)
# Visualizae the output of the first convolutional layer
fig, axes = plt.subplots(2, 3, figsize=(18, 10))
ax = axes.ravel()
for i in range(6):
sns.heatmap(p1[0][i].detach().numpy(), ax=ax[i], cmap='gray')
ax[i].set_title('Image {}'.format(i+1))
# Add title to the figure
fig.suptitle('Max Pooling Layer 1', fontsize=16)
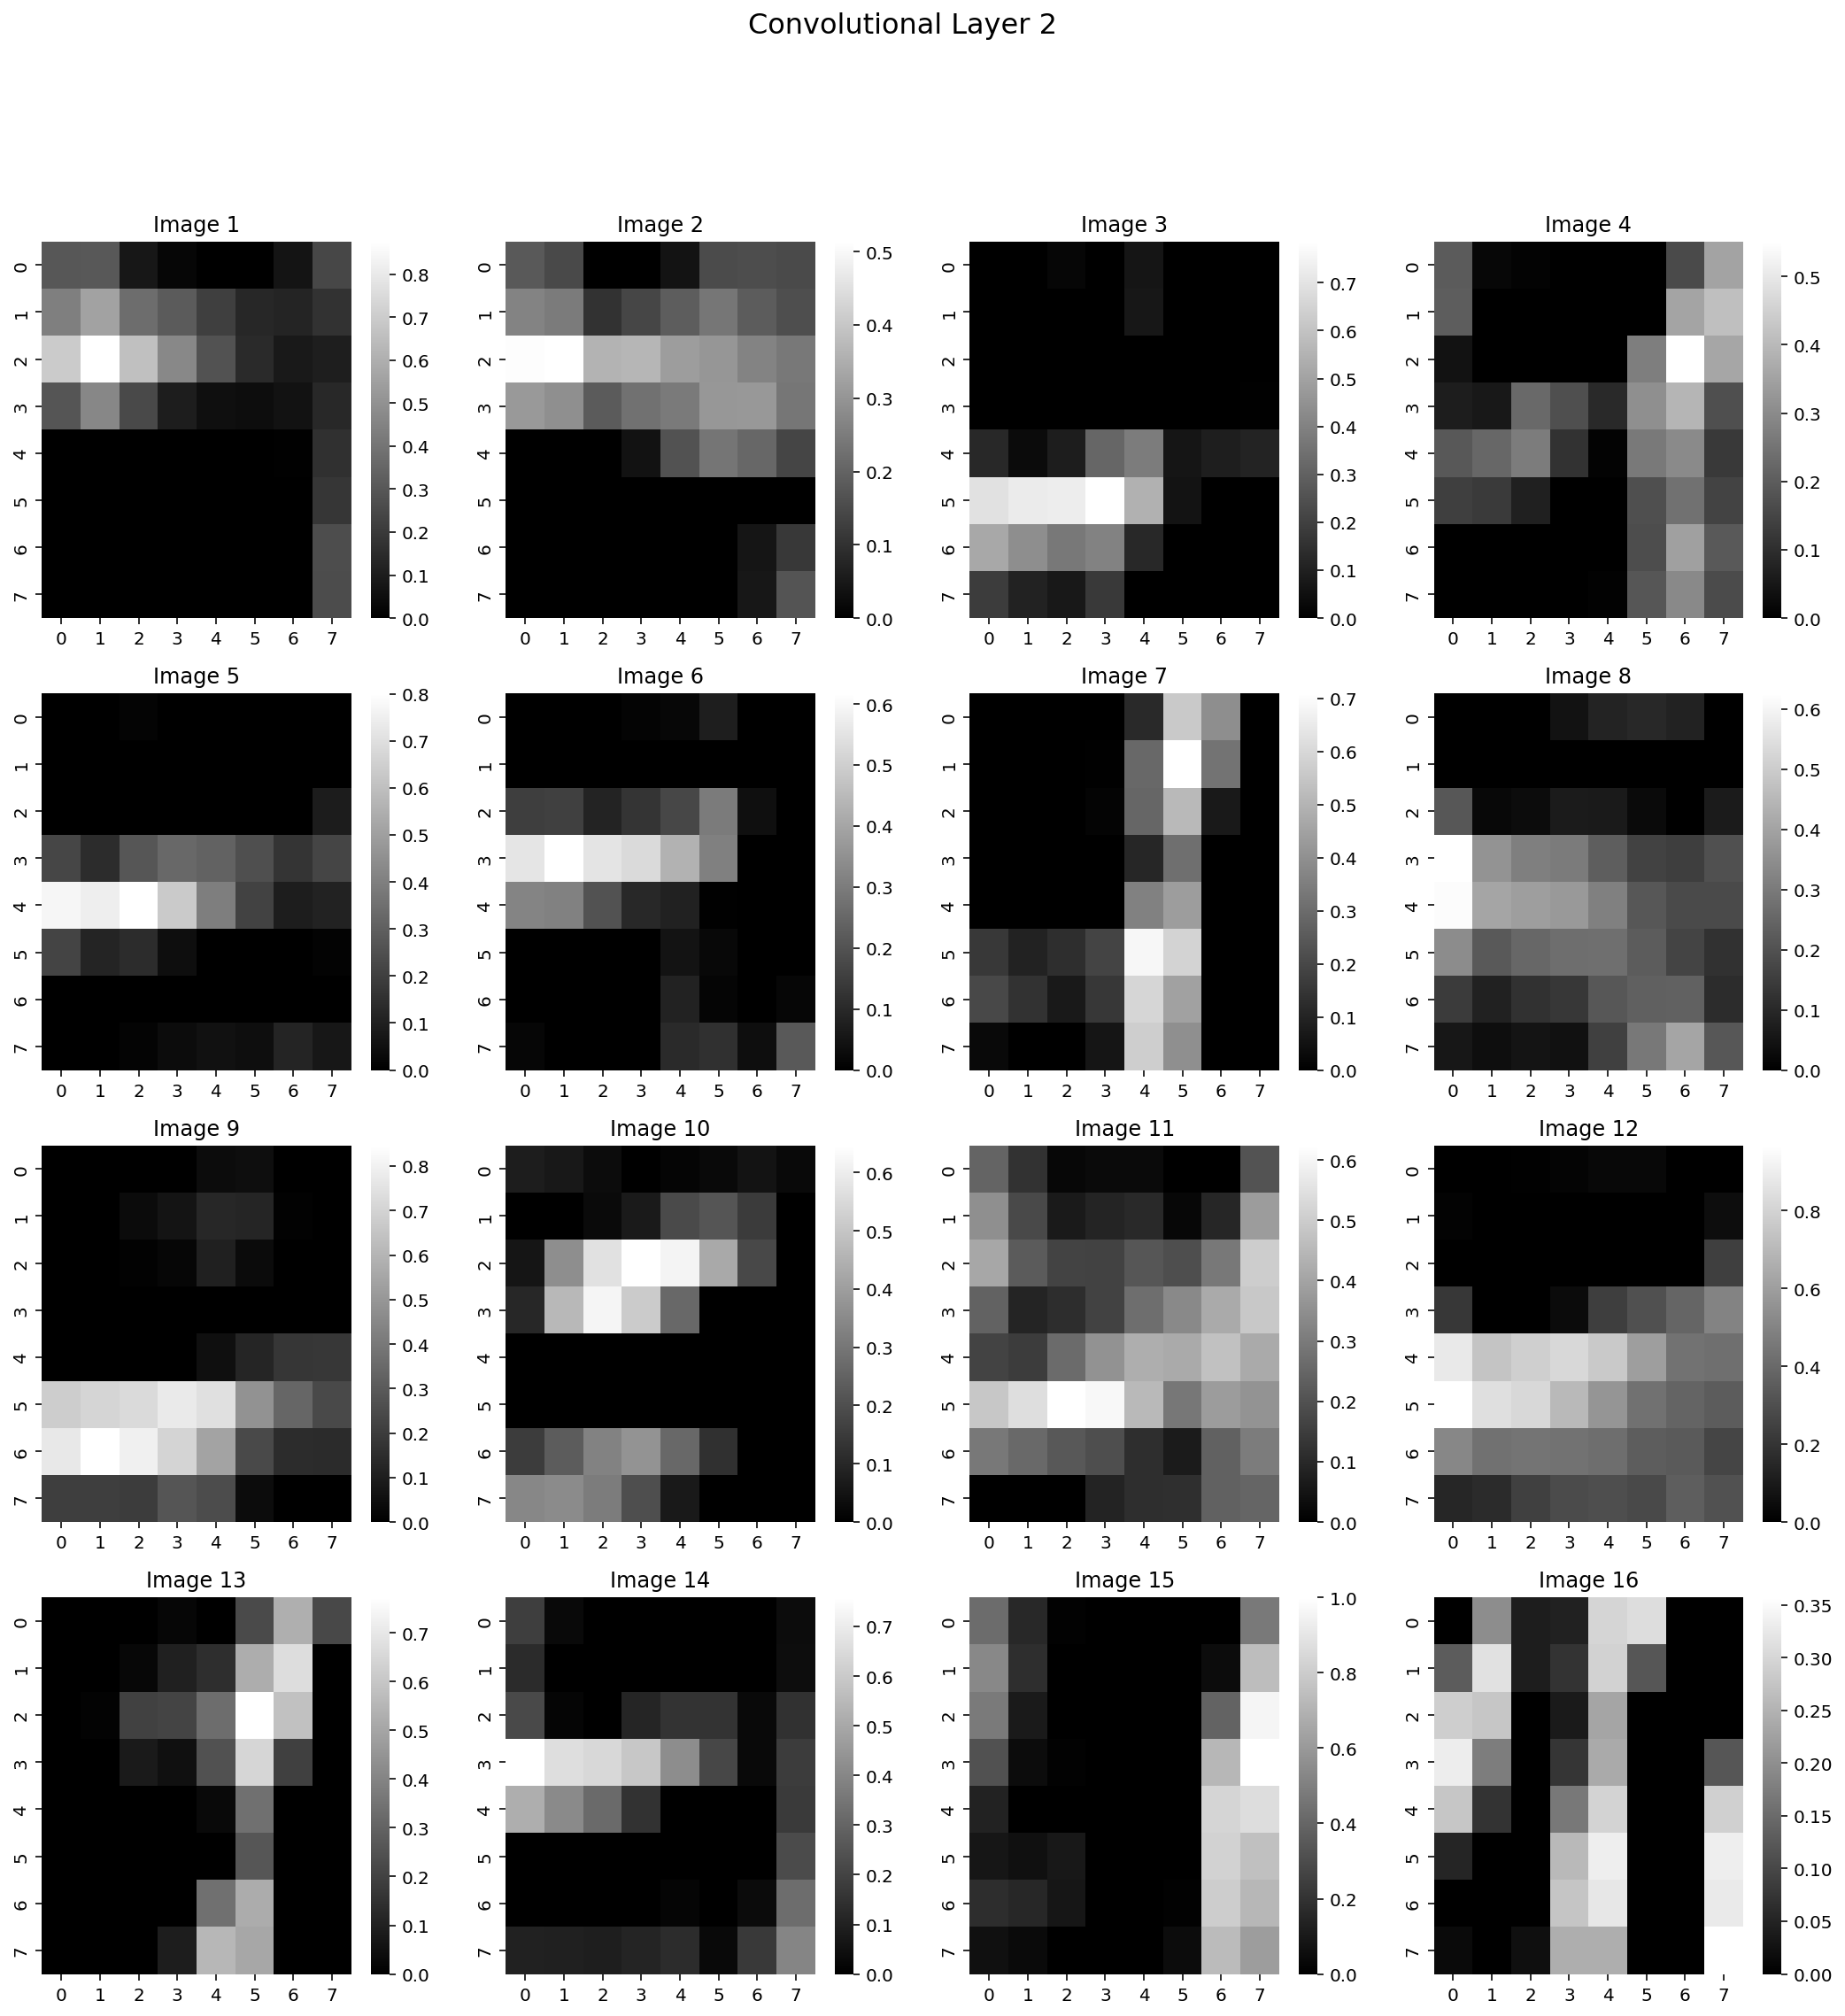
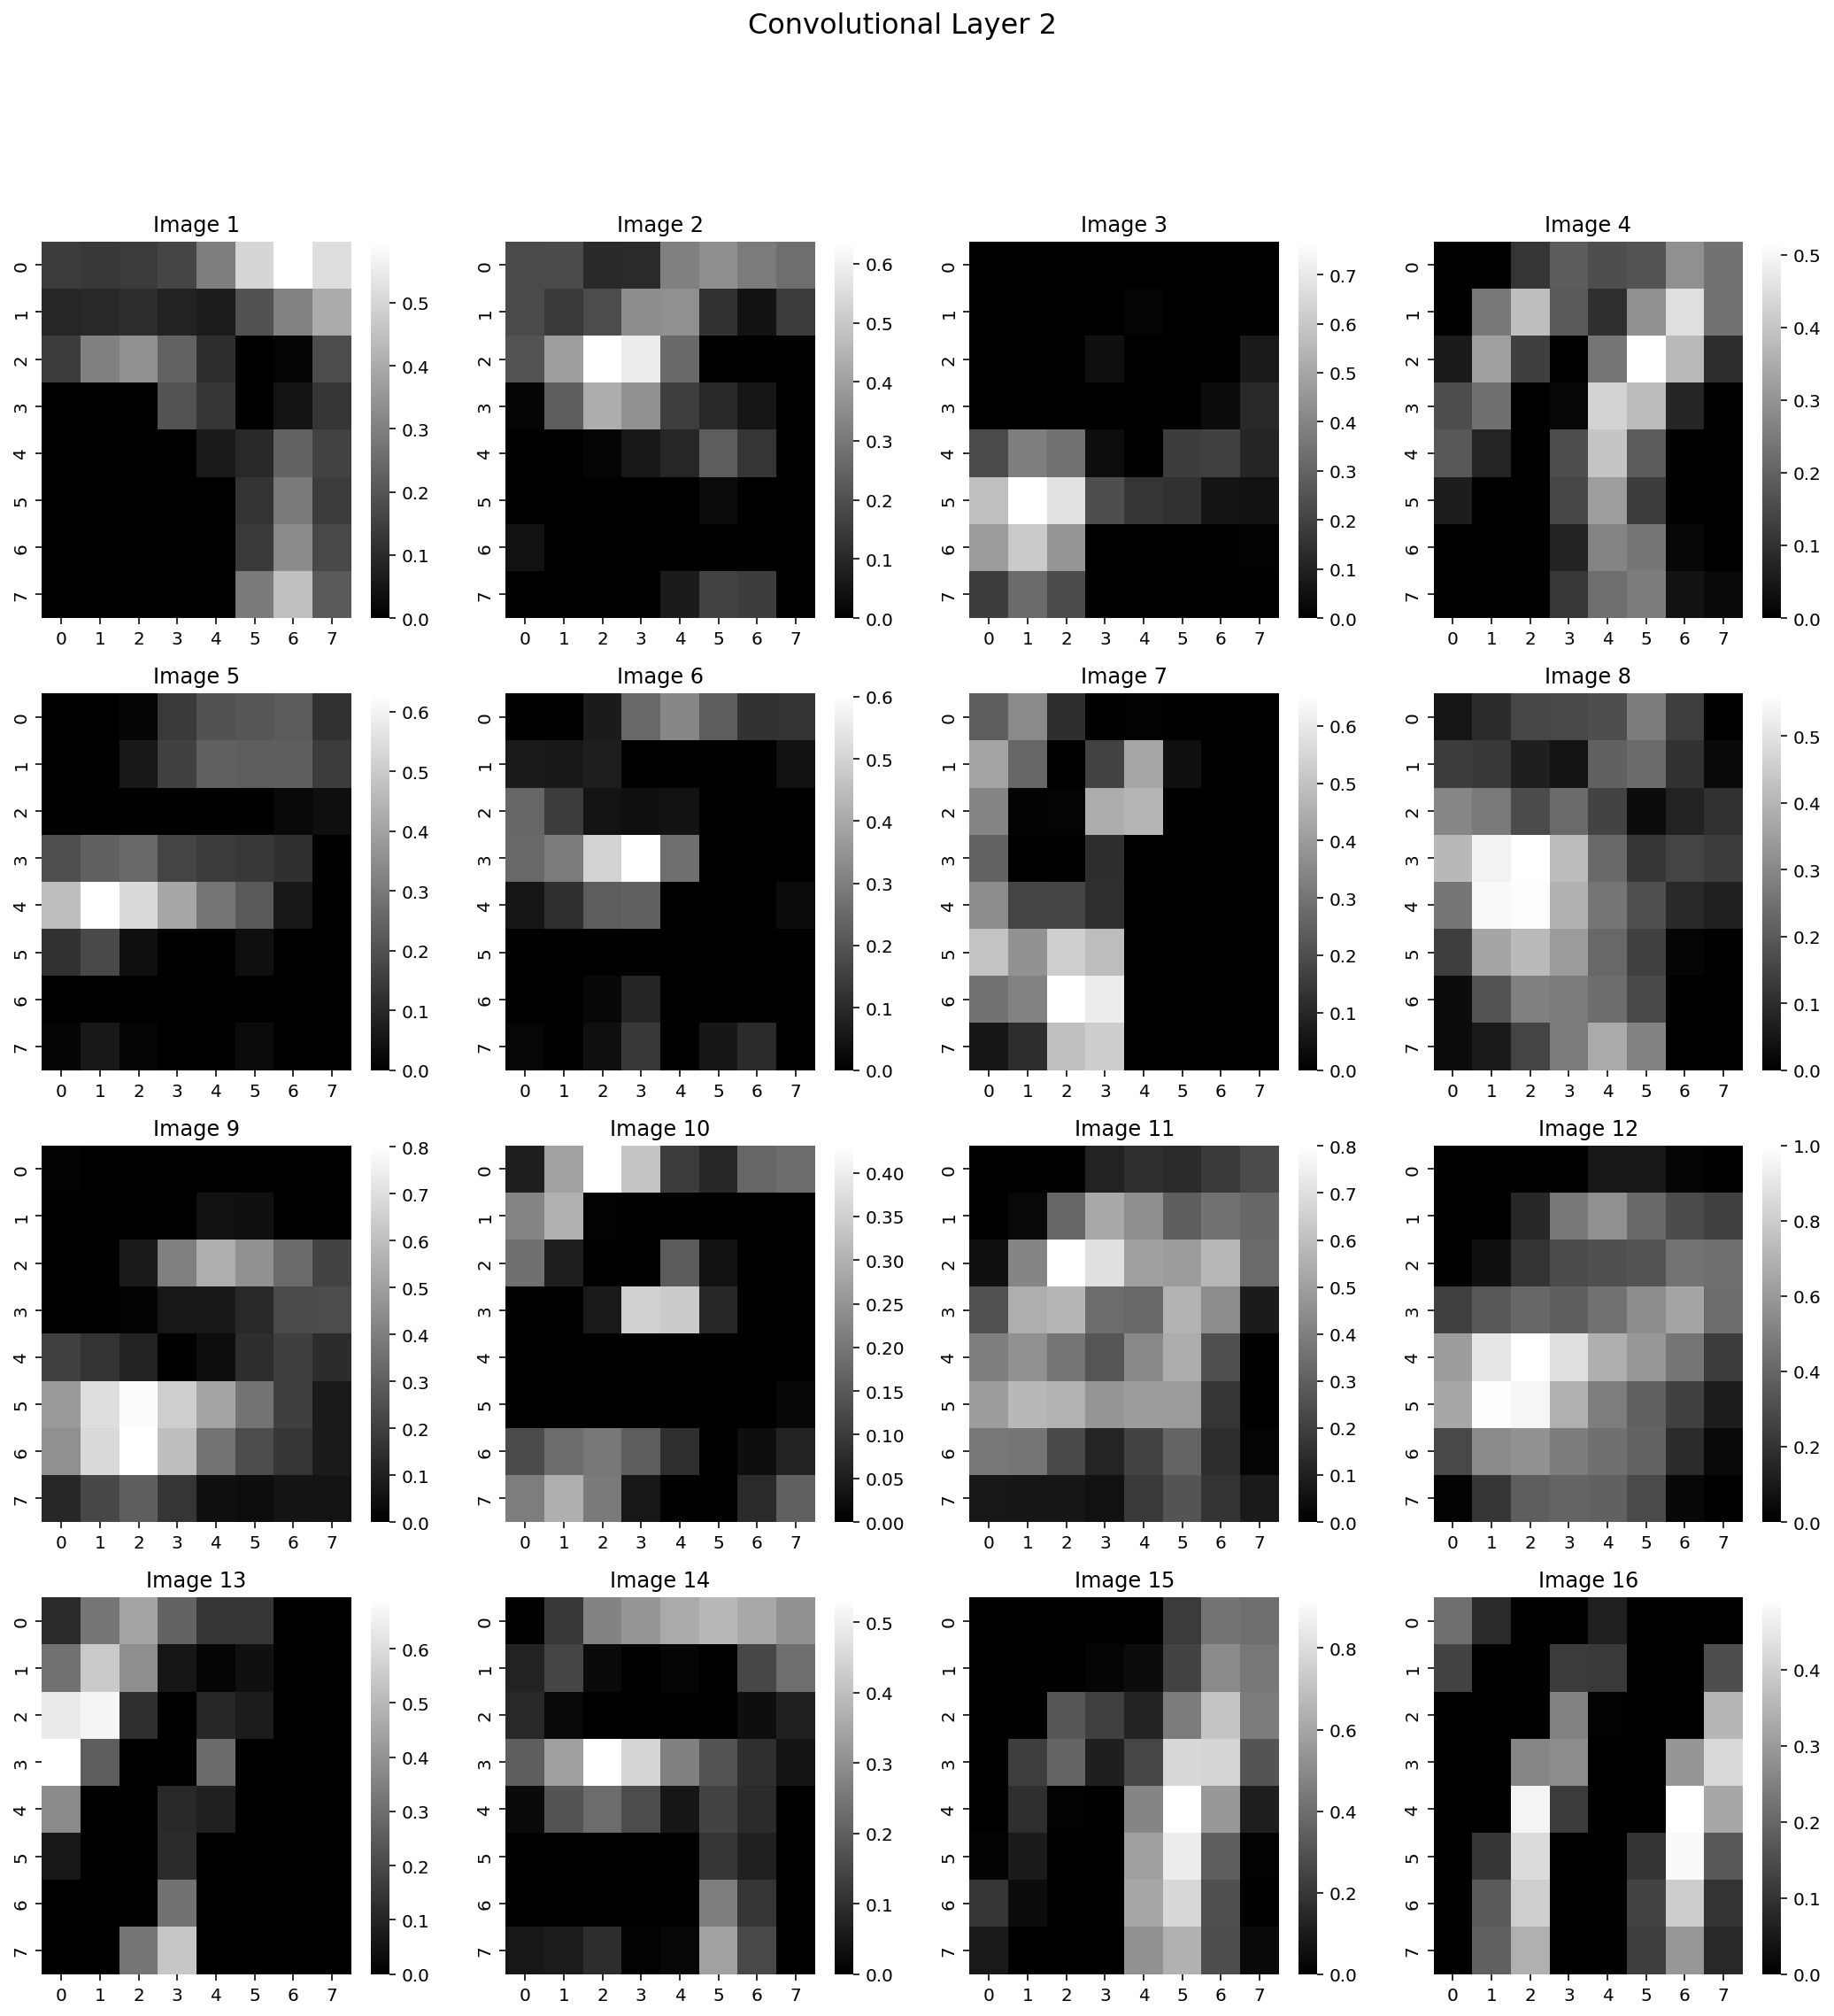
# Get output from model's second conv2 layer
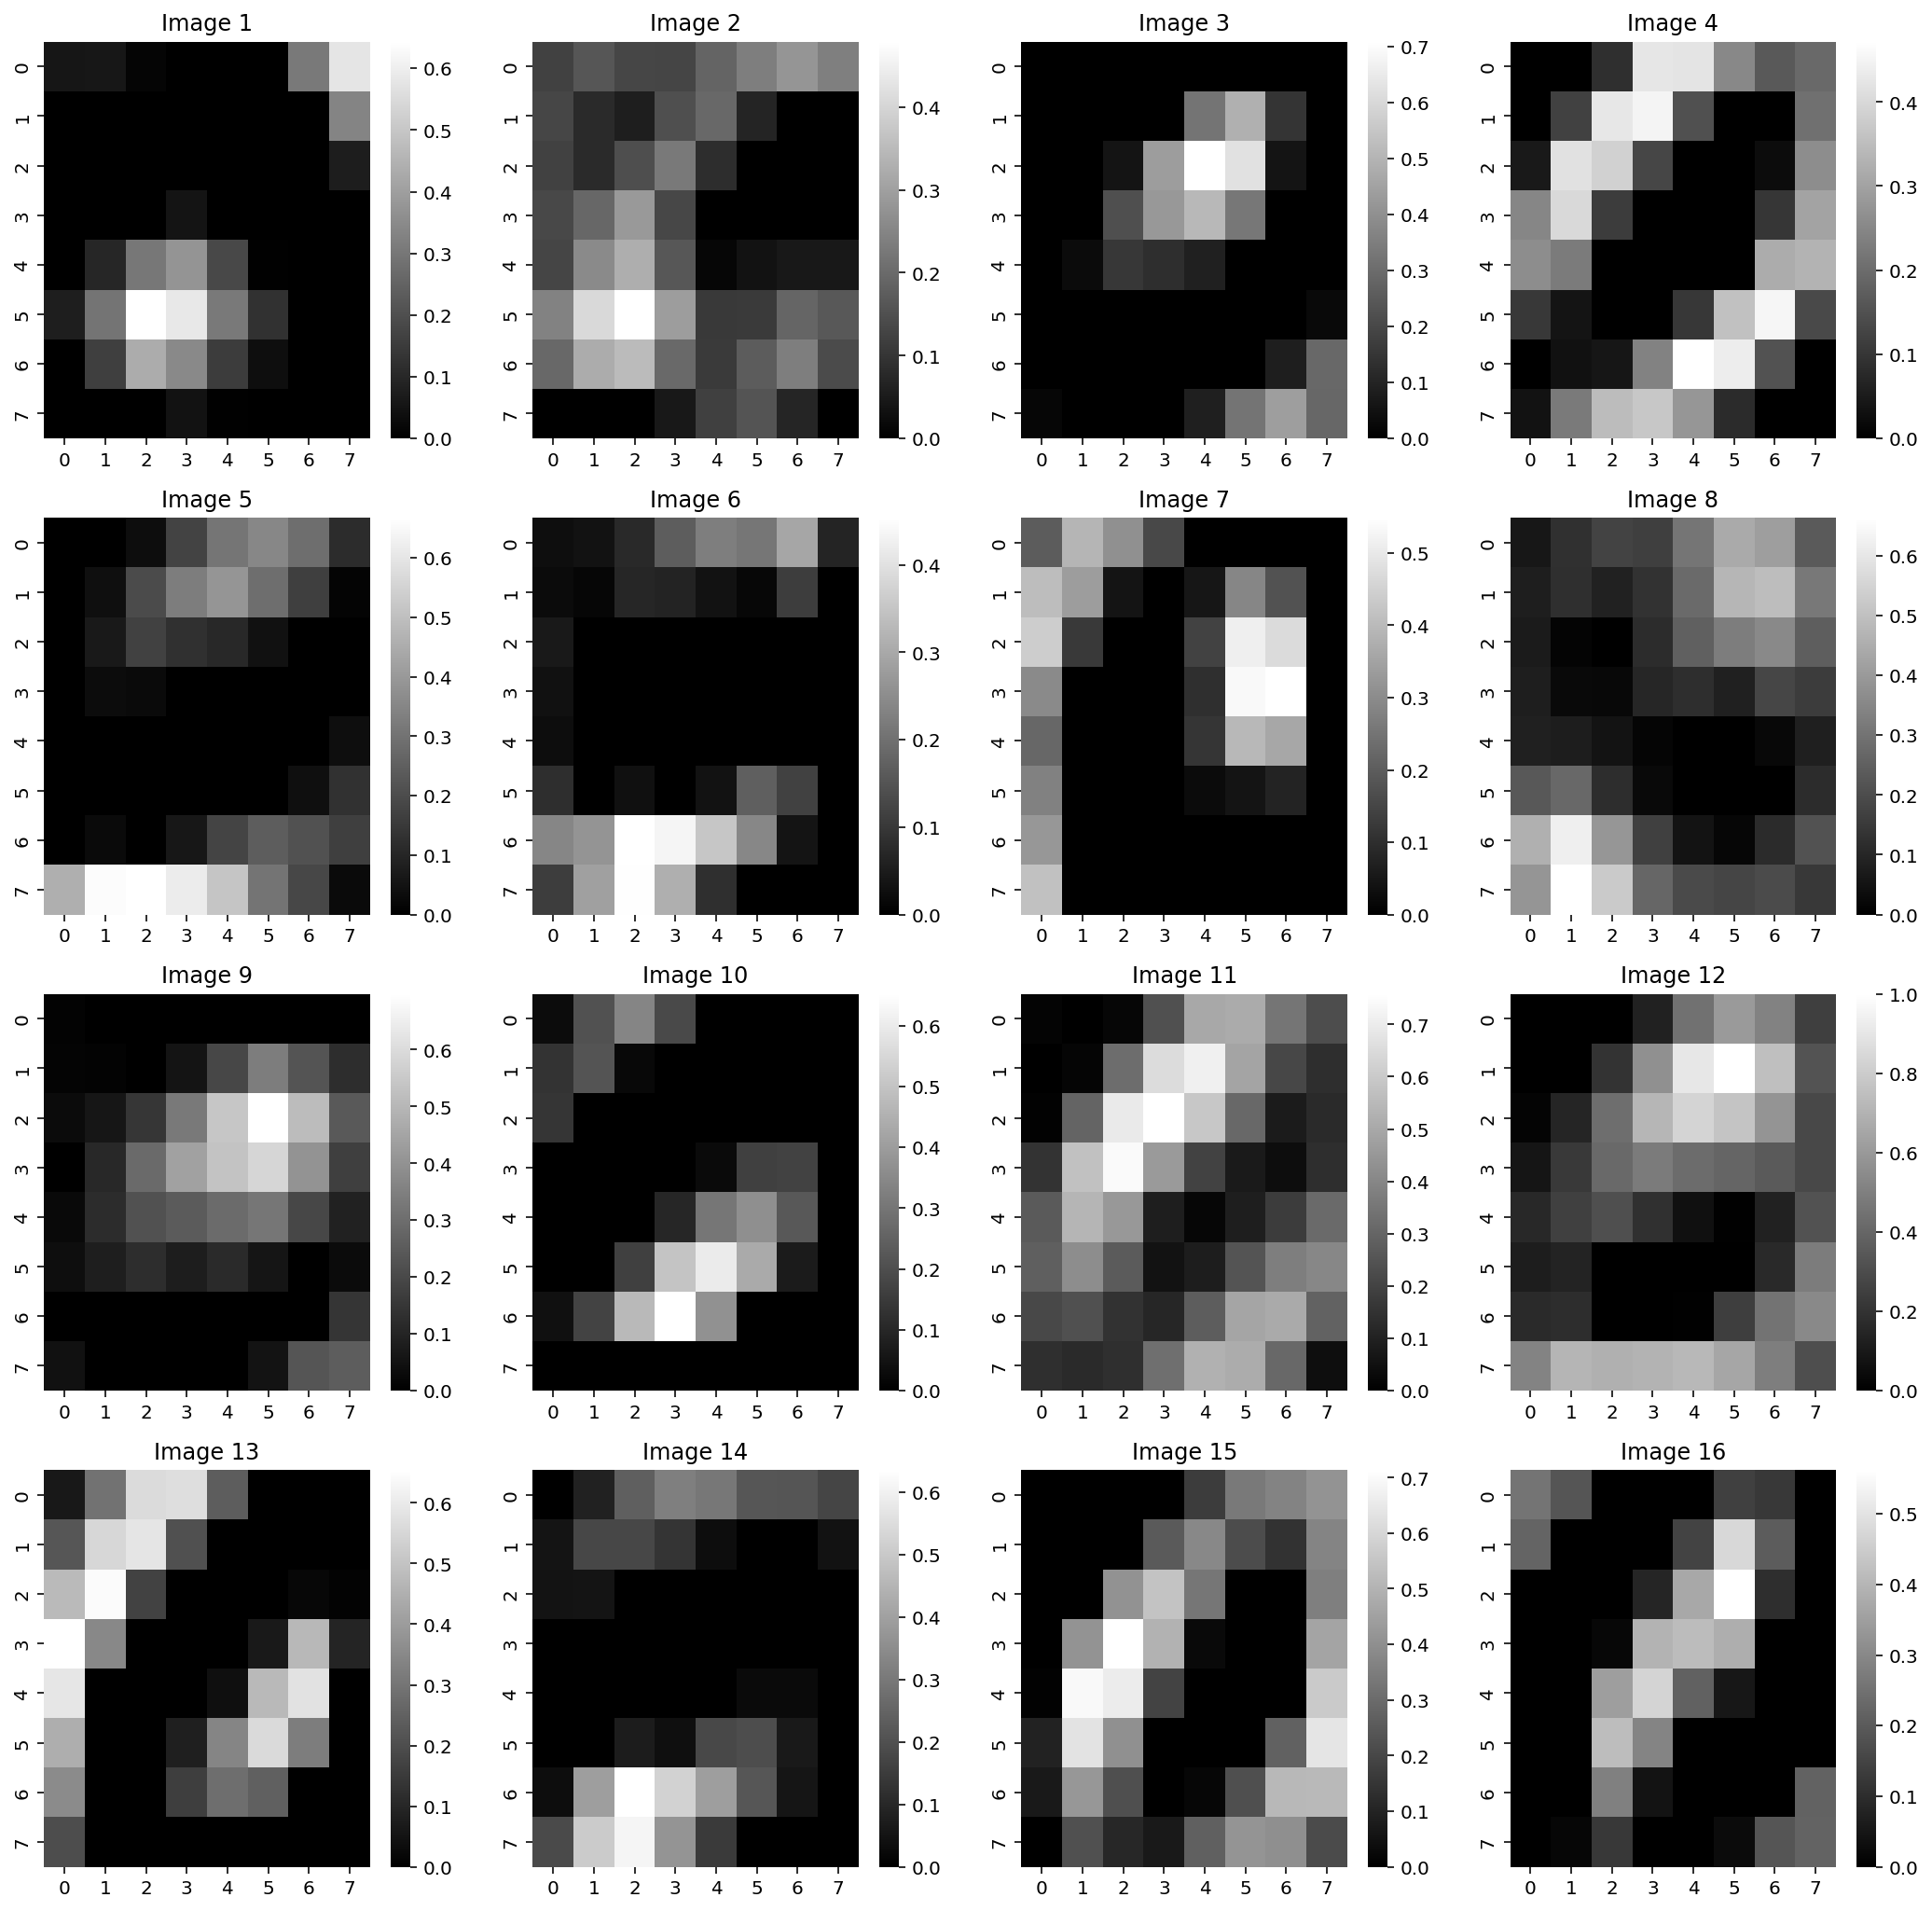
conv2 = F.relu(model.conv2(pool1))
# For plotting bring all the images to the same scale
c2 = scale_img(conv2)
# Visualizae the output of the first convolutional layer
fig, axes = plt.subplots(4, 4, figsize=(18, 18))
ax = axes.ravel()
for i in range(16):
sns.heatmap(c2[0][i].detach().numpy(), ax=ax[i], cmap='gray')
ax[i].set_title('Image {}'.format(i+1))
# Add title to the figure
fig.suptitle('Convolutional Layer 2', fontsize=16)
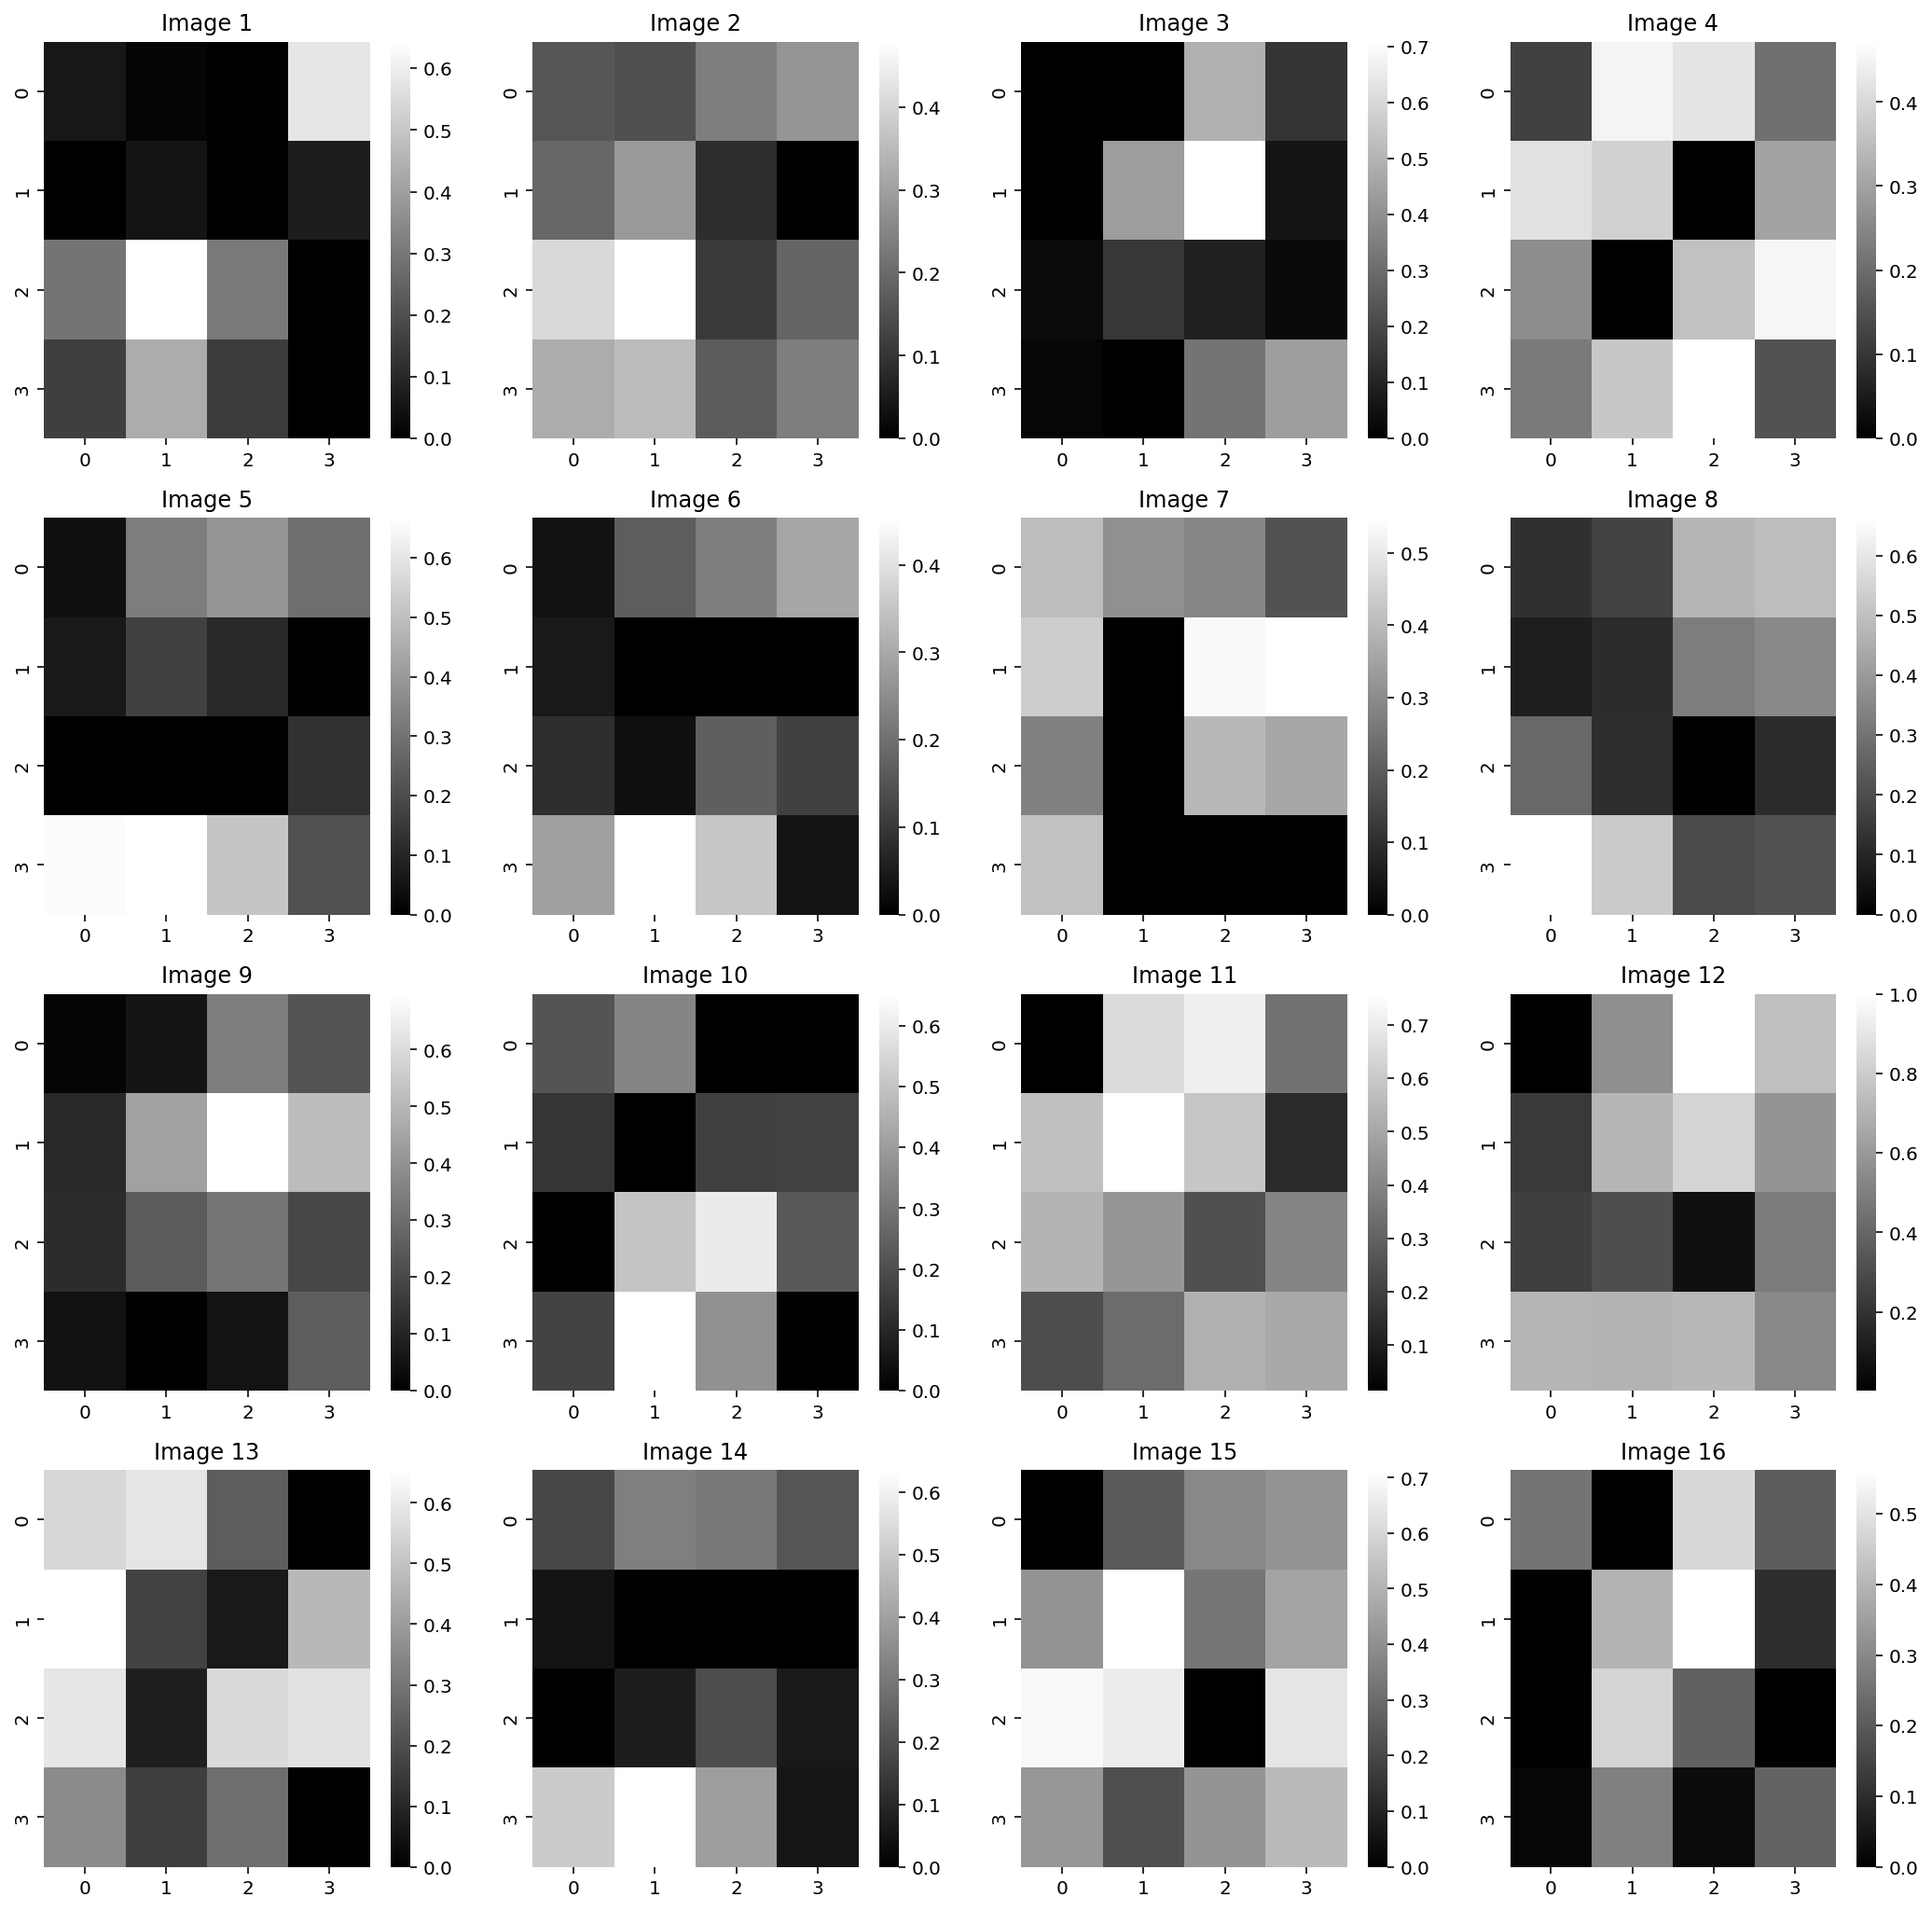
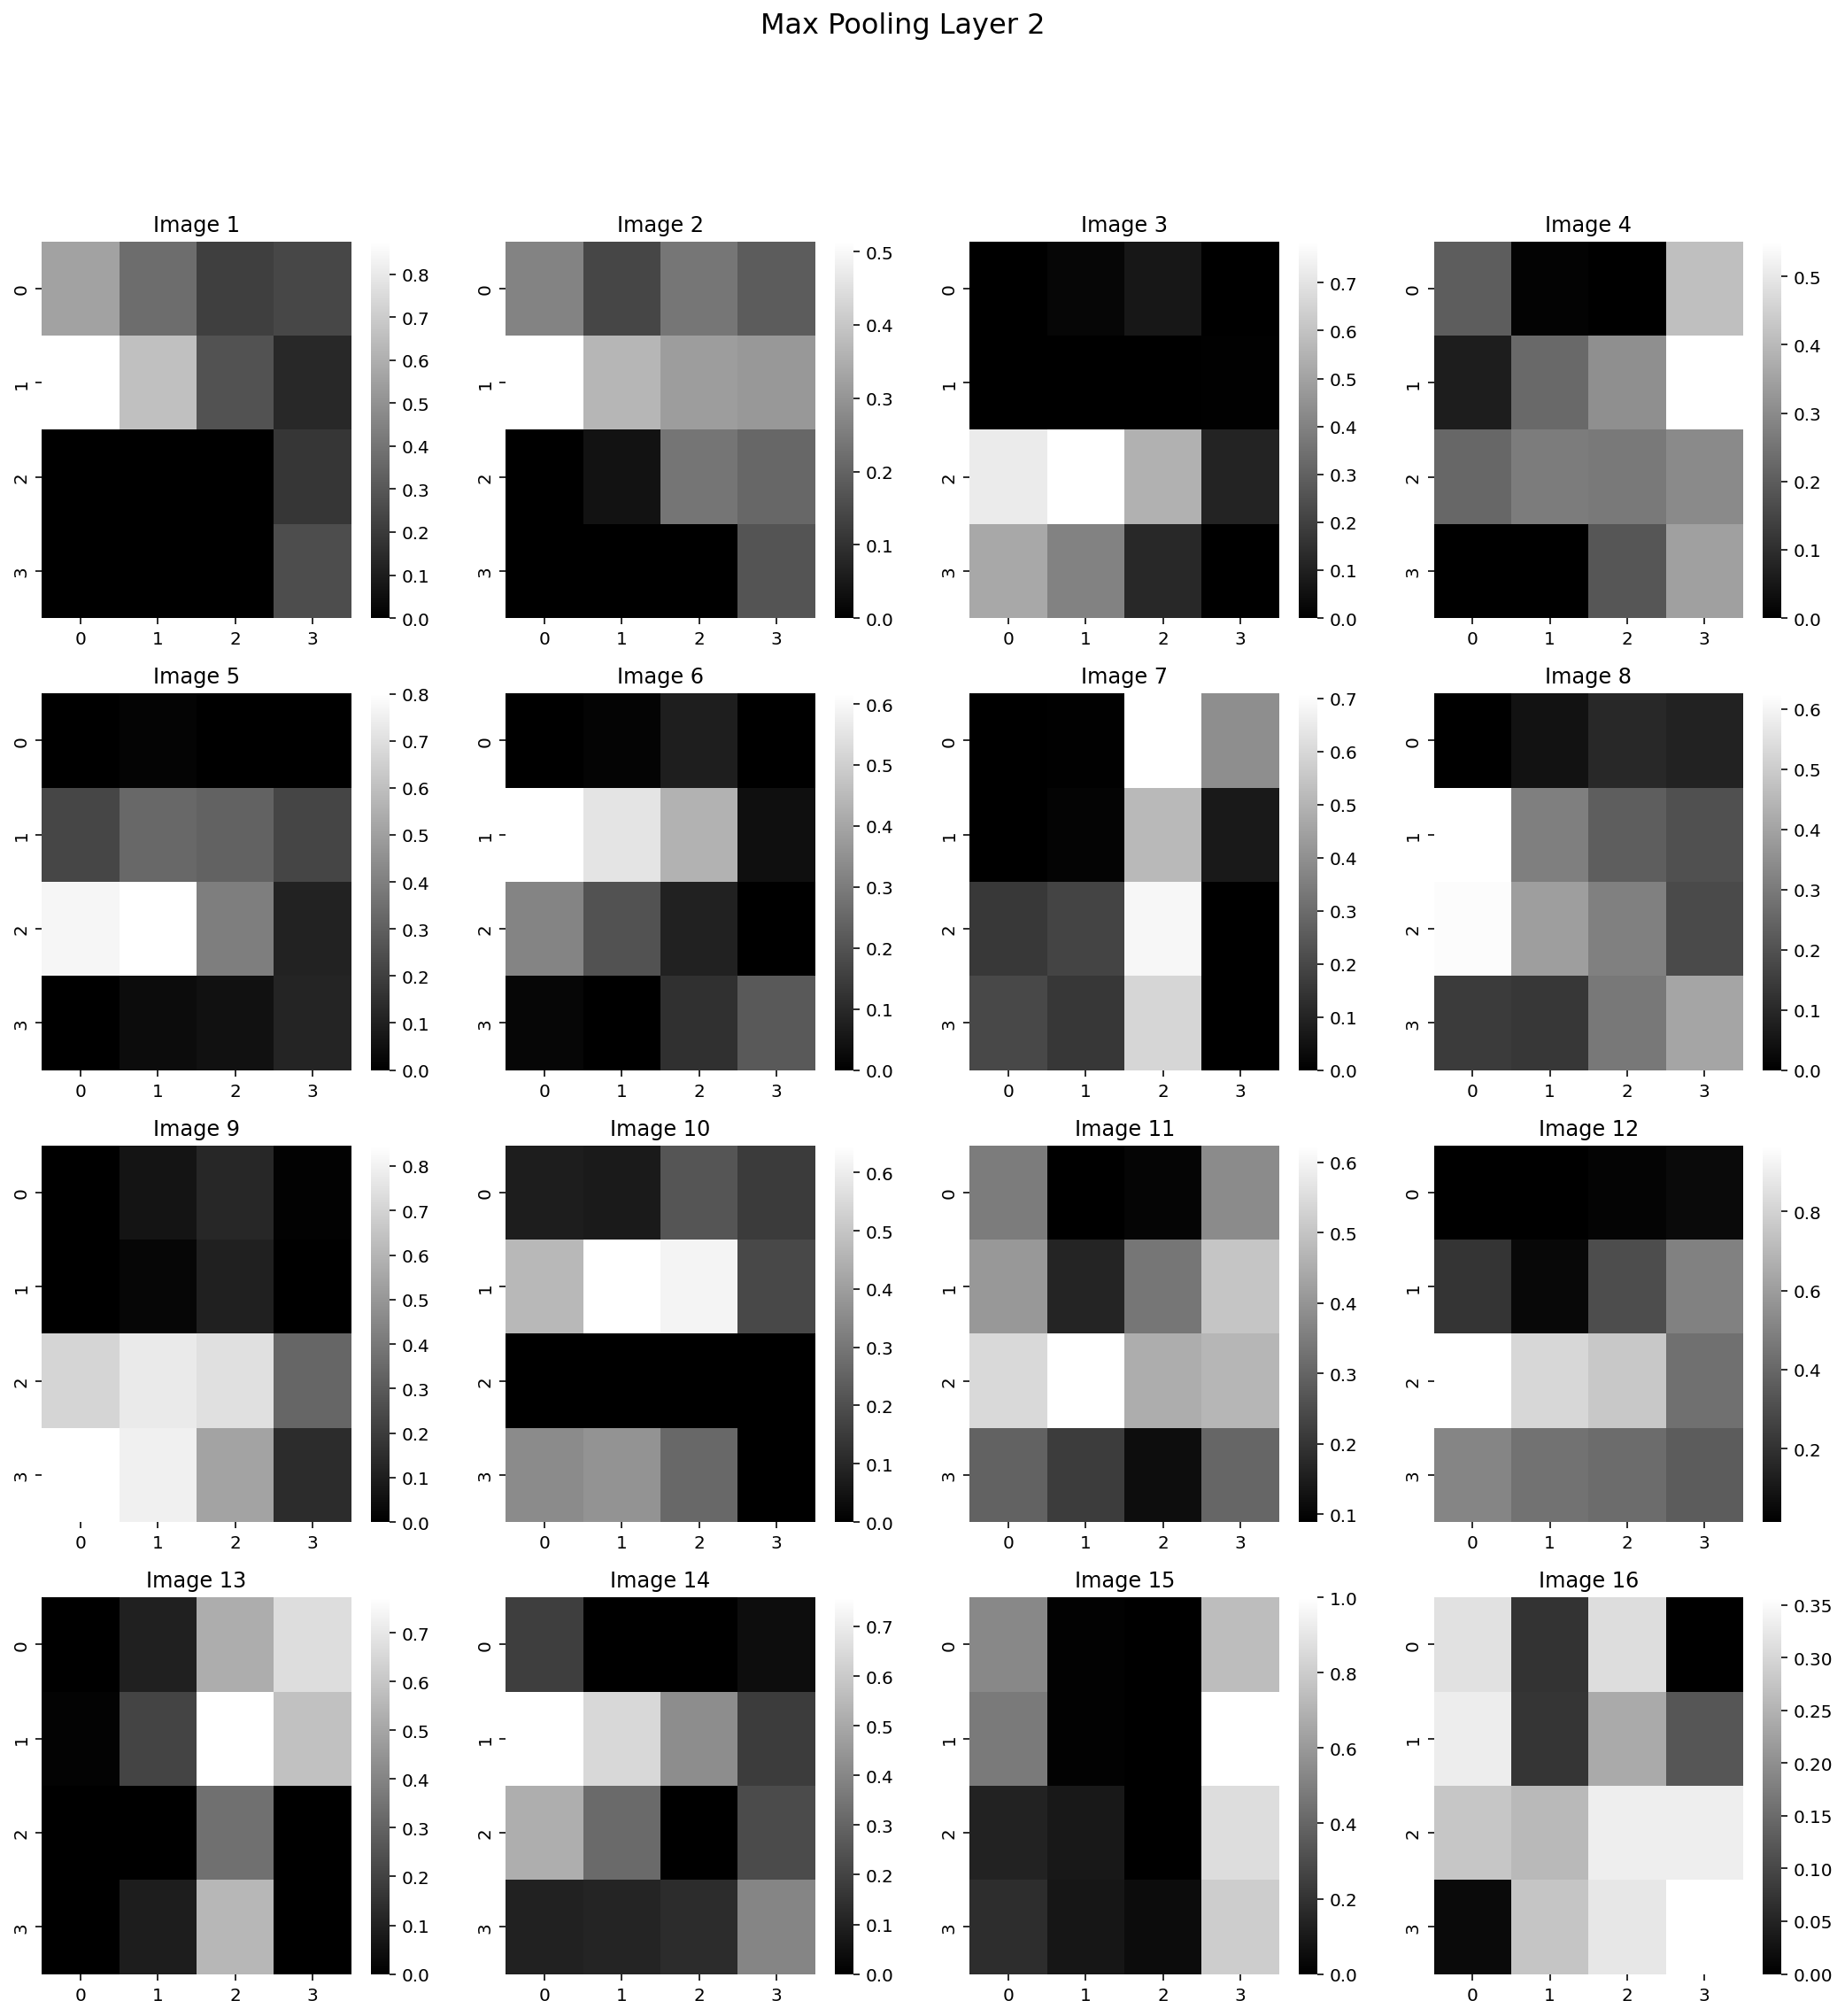
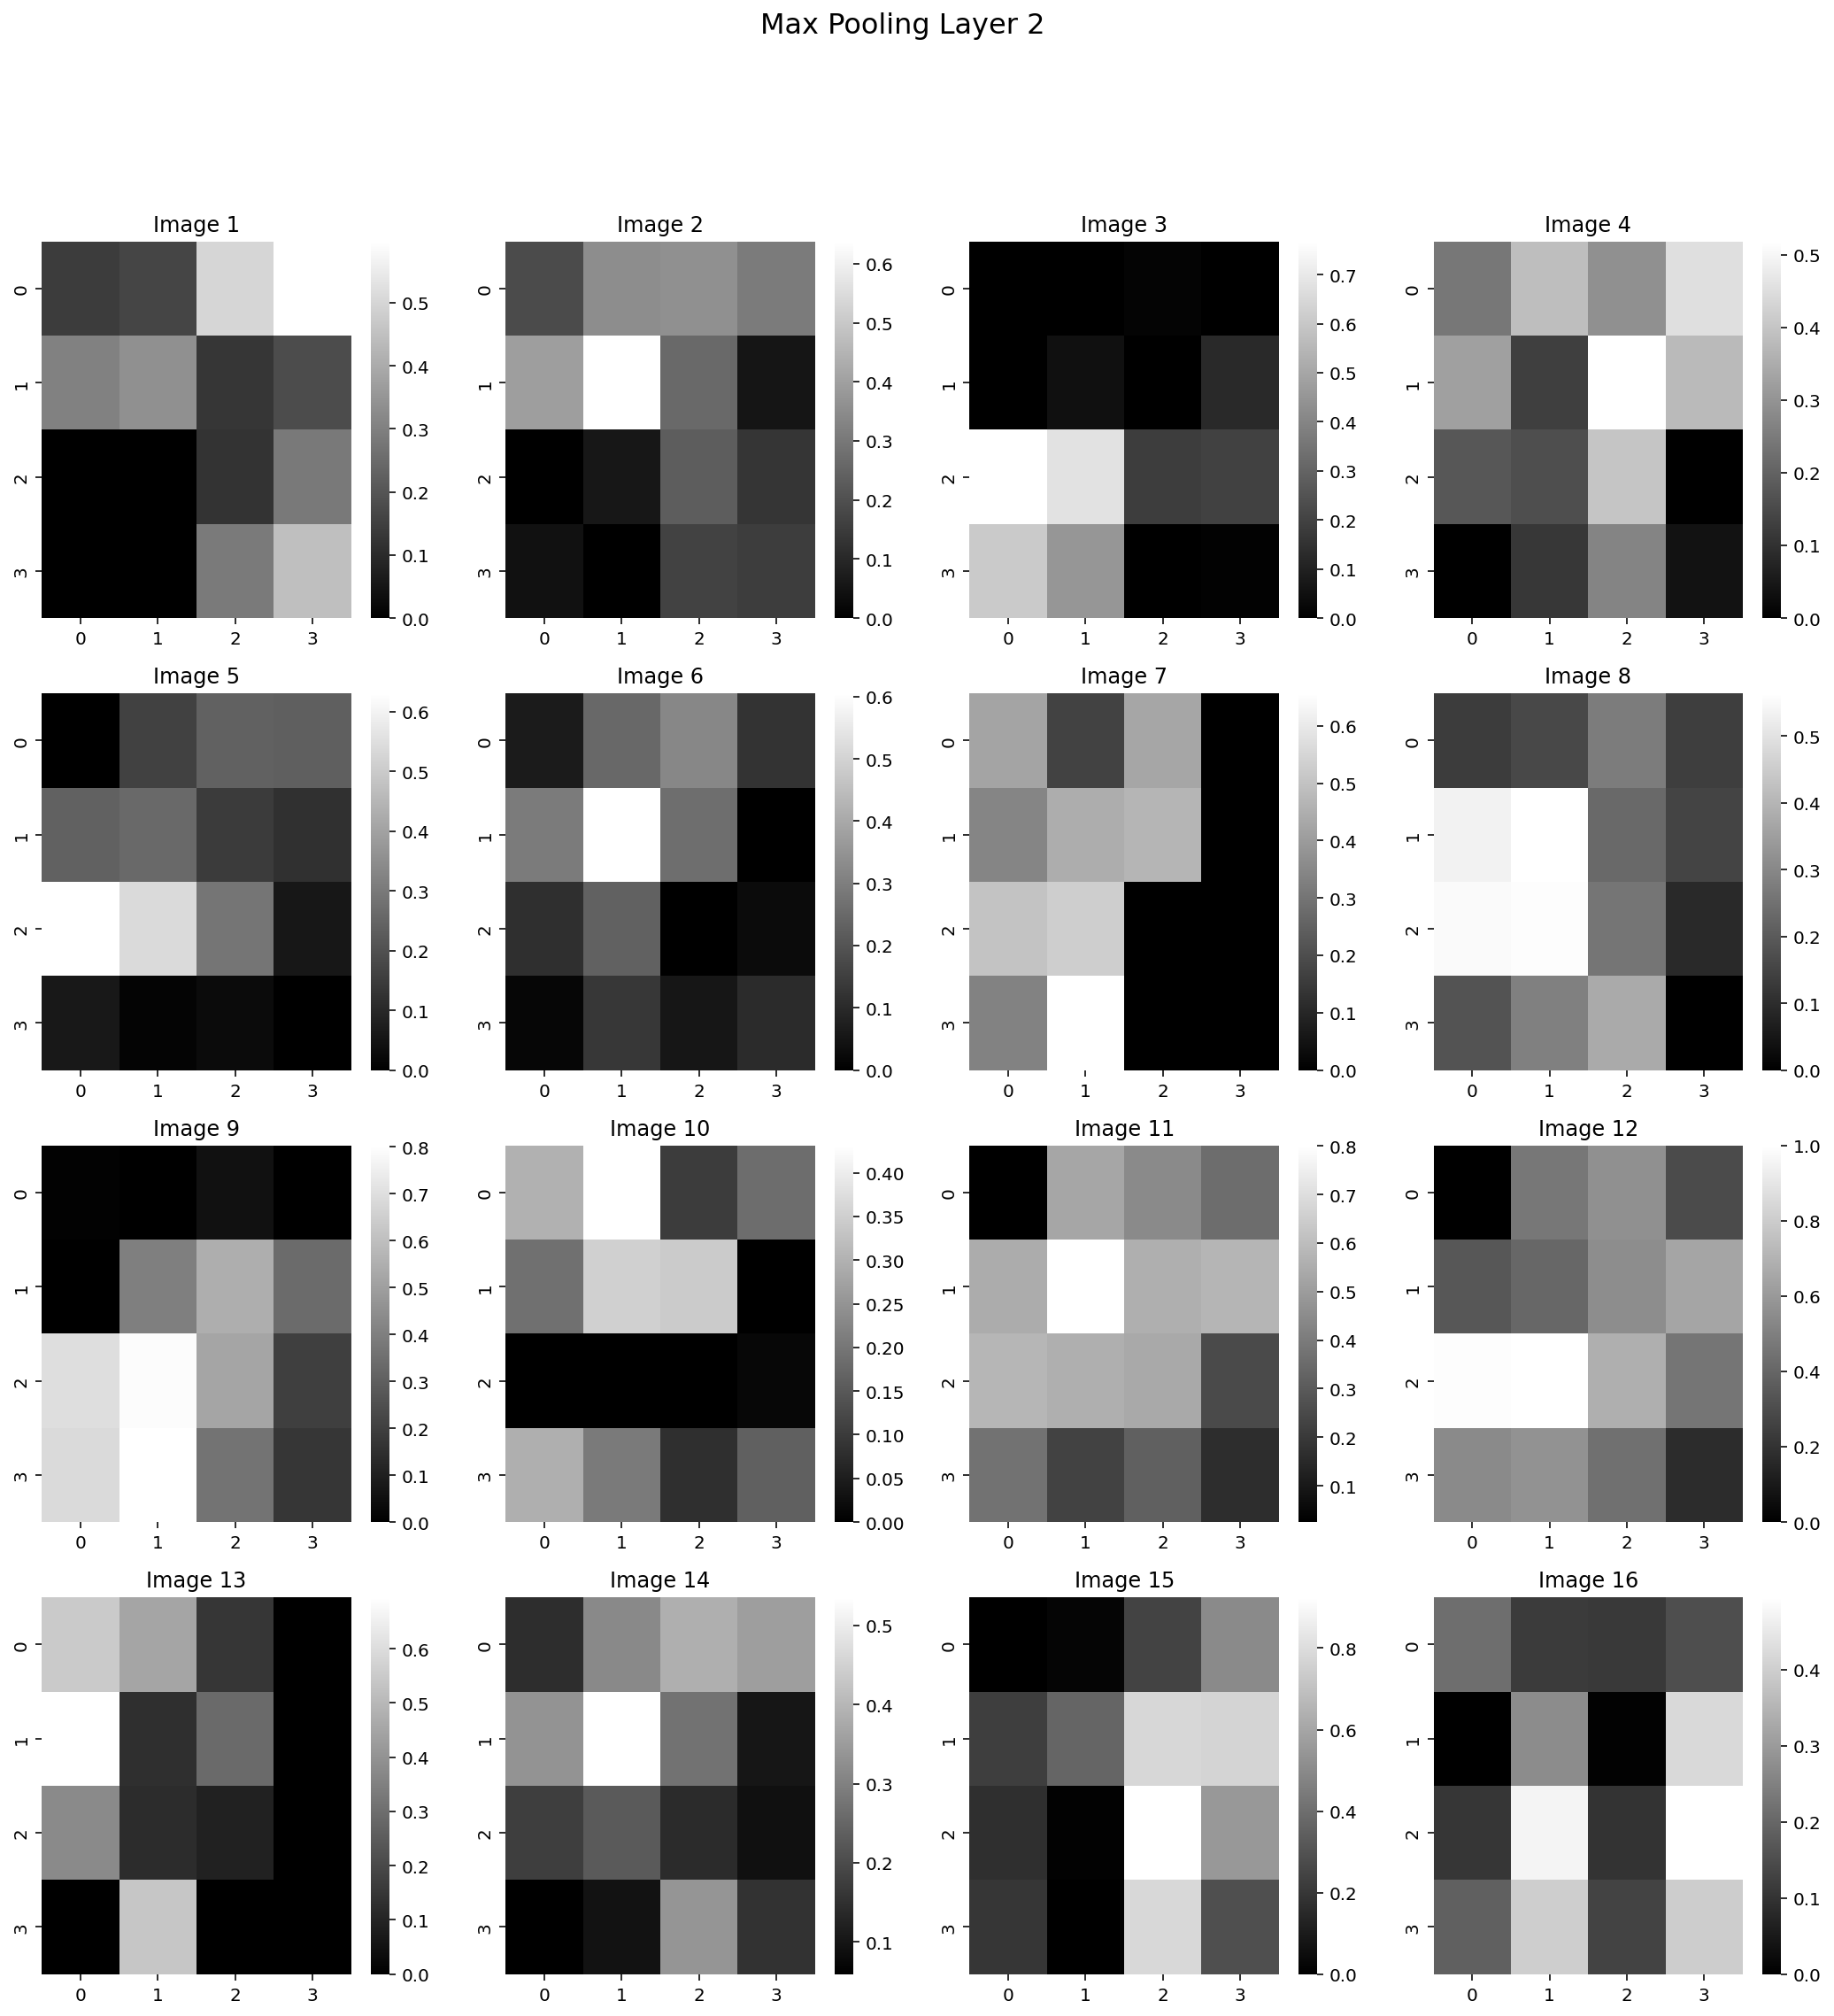
# Get output from model after max pooling
pool2 = F.max_pool2d(conv2, 2)
# For plotting bring all the images to the same scale
p2 = scale_img(pool2)
# Visualizae the output of the first convolutional layer
fig, axes = plt.subplots(4, 4, figsize=(18, 18))
ax = axes.ravel()
for i in range(16):
sns.heatmap(p2[0][i].detach().numpy(), ax=ax[i], cmap='gray')
ax[i].set_title('Image {}'.format(i+1))
# Add title to the figure
fig.suptitle('Max Pooling Layer 2', fontsize=16)