import numpy as np
import pandas as pd
import matplotlib.pyplot as plt
%matplotlib inlineCost Iteration Notebook
Interactive tutorial on cost iteration notebook with practical implementations and visualizations
![]()
X = np.array([1, 2, 3])
y = np.array([1, 2, 3])
def y_hat(X, theta_0, theta_1):
return theta_0 + theta_1*Xdef cost(X, y, theta_0, theta_1):
yh = y_hat(X, theta_0, theta_1)
return (y-yh).T@(y-yh)theta_0 = 4
theta_1 = 0
alpha = 0.1
costs = np.zeros(1000)
theta_0_list = np.zeros(1000)
theta_1_list = np.zeros(1000)
for i in range(1000):
costs[i] = cost(X, y, theta_0, theta_1)
theta_0 = theta_0 - 2*alpha*((y_hat(X, theta_0, theta_1)-y).mean())
theta_1 = theta_1 - 2*alpha*((y_hat(X, theta_0, theta_1)-y).T@X)/len(X)
theta_0_list[i] = theta_0
theta_1_list[i] = theta_1import sys
sys.path.append("../")
from latexify import *latexify()
plt.plot(costs[:200], 'k')
format_axes(plt.gca())
plt.ylabel("Cost")
plt.xlabel("Iteration")
plt.savefig("../gradient-descent/gd-iter-cost.pdf", bbox_inches="tight", transparent=True)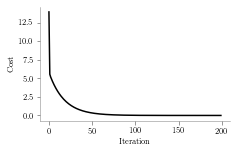
for i in range(0, 200, 20):
    plt.title(label="Fit at iteration {}".format(i))
    plt.plot(X, theta_0_list[i]+theta_1_list[i]*X, color='k')
    plt.scatter(X, y, color='k')
    plt.xlabel("x")
    plt.ylabel("y")
    format_axes(plt.gca())
    plt.savefig("../gradient-descent/fit-iteration-{}.pdf".format(i), bbox_inches="tight", transparent=True)
    plt.cla()
theta_0 = 4
theta_1 = 0
(y_hat(X, theta_0, theta_1)-y).mean()2.0(y-y_hat(X, theta_0, theta_1)).mean()-2.0(y-y_hat(X, theta_0, theta_1))@X-10