import matplotlib.pyplot as plt
import numpy as np
import pandas as pd
# Retina mode
%matplotlib inline
%config InlineBackend.figure_format = 'retina'

from latexify import latexify, format_axesDecision Trees Real Output
ML
![]()
df = pd.read_csv("../datasets/tennis-real-output.csv", index_col=[0])df| Outlook | Temp | Humidity | Wind | Minutes Played | |
|---|---|---|---|---|---|
| Day | |||||
| D1 | Sunny | Hot | High | Weak | 20 |
| D2 | Sunny | Hot | High | Strong | 24 |
| D3 | Overcast | Hot | High | Weak | 40 |
| D4 | Rain | Mild | High | Weak | 50 |
| D5 | Rain | Cool | Normal | Weak | 60 |
| D6 | Rain | Cool | Normal | Strong | 10 |
| D7 | Overcast | Cool | Normal | Strong | 4 |
| D8 | Sunny | Mild | High | Weak | 10 |
| D9 | Sunny | Cool | Normal | Weak | 60 |
| D10 | Rain | Mild | Normal | Weak | 40 |
| D11 | Sunny | Mild | High | Strong | 45 |
| D12 | Overcast | Mild | High | Strong | 40 |
| D13 | Overcast | Hot | Normal | Weak | 35 |
| D14 | Rain | Mild | High | Strong | 20 |
mean_mins = df["Minutes Played"].mean()
print(mean_mins)32.714285714285715initial_mse = ((df["Minutes Played"] - mean_mins) ** 2).mean()
print(initial_mse)311.3469387755102# Explore MSE for different splits based on the "Outlook" attribute
weighted_total_mse = 0.0
for category in df["Wind"].unique():
subset = df[df["Wind"] == category]
# Calculate MSE for the subset
mse_subset = ((subset["Minutes Played"] - subset["Minutes Played"].mean()) ** 2).mean()
# Calculate the weighted MSE
weighted_mse = (len(subset) / len(df)) * mse_subset
weighted_total_mse = weighted_total_mse + weighted_mse
print(subset["Minutes Played"].values)
print(f"Wind: {category}")
print("Subset MSE:", mse_subset)
print(f"Weighted MSE = {len(subset)}/{len(df)} * {mse_subset:0.4} = {weighted_mse:0.4}")
print("\n")
print("Weighted total MSE:", weighted_total_mse)[20 40 50 60 10 60 40 35]
Wind: Weak
Subset MSE: 277.734375
Weighted MSE = 8/14 * 277.7 = 158.7
[24 10 4 45 40 20]
Wind: Strong
Subset MSE: 218.13888888888889
Weighted MSE = 6/14 * 218.1 = 93.49
Weighted total MSE: 252.19345238095235reduction_mse_wind = initial_mse - weighted_total_mse
print(reduction_mse_wind)59.15348639455783def reduction_mse(df_dataset, input_attribute, target_attribute):
# Calculate the initial MSE
mean_target = df_dataset[target_attribute].mean()
initial_mse = ((df_dataset[target_attribute] - mean_target) ** 2).mean()
weighted_total_mse = 0.0
for category in df_dataset[input_attribute].unique():
subset = df_dataset[df_dataset[input_attribute] == category]
mse_subset = ((subset[target_attribute] - subset[target_attribute].mean()) ** 2).mean()
weighted_mse = (len(subset) / len(df_dataset)) * mse_subset
weighted_total_mse = weighted_total_mse + weighted_mse
return initial_mse - weighted_total_mse
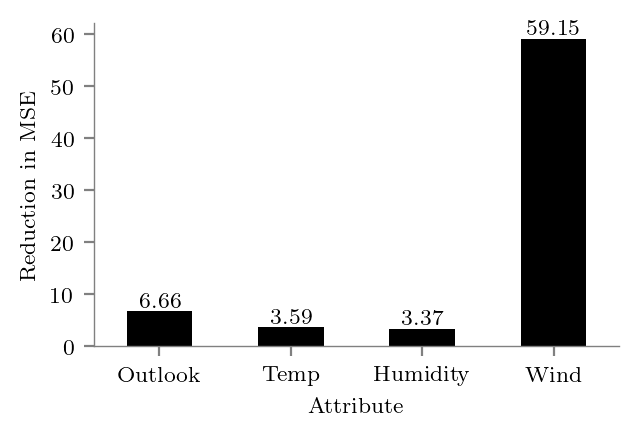
reduction = {}
for attribute in ["Outlook", "Temp", "Humidity", "Wind"]:
    reduction[attribute] = reduction_mse(df, attribute, "Minutes Played")

reduction_ser = pd.Series(reduction)latexify()bars = reduction_ser.plot(kind='bar', rot=0, color='k')
format_axes(plt.gca())
# Add values on top of the bars
for bar in bars.patches:
yval = bar.get_height()
plt.text(bar.get_x() + bar.get_width()/2, yval, round(yval, 2), ha='center', va='bottom')
plt.xlabel("Attribute")
plt.ylabel("Reduction in MSE")
plt.savefig("../figures/decision-trees/discrete-input-real-output-level-1.pdf")