import matplotlib.pyplot as plt
import numpy as np
# Retina mode
%matplotlib inline
%config InlineBackend.figure_format = 'retina'Decision Trees Entropy
ML
![]()
from latexify import latexify, format_axes
from scipy.special import xlogy

# Function to calculate entropy
def entropy(p):
    return -p * np.log2(p) - (1 - p) * np.log2(1 - p)

# Generate data
x_values = np.linspace(0.000, 1.0, 100)  # Avoid log(0) in the calculation
y_values = entropy(x_values)y_valuesarray([ nan, 0.08146203, 0.14257333, 0.19590927, 0.24414164,
0.28853851, 0.32984607, 0.36855678, 0.40502013, 0.43949699,
0.47218938, 0.50325833, 0.53283506, 0.56102849, 0.58793037,
0.61361902, 0.63816195, 0.66161791, 0.68403844, 0.70546904,
0.72595015, 0.74551784, 0.76420451, 0.78203929, 0.79904852,
0.81525608, 0.83068364, 0.84535094, 0.85927598, 0.87247521,
0.88496364, 0.89675502, 0.90786192, 0.91829583, 0.92806728,
0.93718586, 0.9456603 , 0.95349858, 0.9607079 , 0.96729478,
0.97326507, 0.97862399, 0.98337619, 0.98752571, 0.99107606,
0.99403021, 0.99639062, 0.99815923, 0.9993375 , 0.9999264 ,
0.9999264 , 0.9993375 , 0.99815923, 0.99639062, 0.99403021,
0.99107606, 0.98752571, 0.98337619, 0.97862399, 0.97326507,
0.96729478, 0.9607079 , 0.95349858, 0.9456603 , 0.93718586,
0.92806728, 0.91829583, 0.90786192, 0.89675502, 0.88496364,
0.87247521, 0.85927598, 0.84535094, 0.83068364, 0.81525608,
0.79904852, 0.78203929, 0.76420451, 0.74551784, 0.72595015,
0.70546904, 0.68403844, 0.66161791, 0.63816195, 0.61361902,
0.58793037, 0.56102849, 0.53283506, 0.50325833, 0.47218938,
0.43949699, 0.40502013, 0.36855678, 0.32984607, 0.28853851,
0.24414164, 0.19590927, 0.14257333, 0.08146203, nan])# Replace NaN values with 0
y_values = np.nan_to_num(y_values, nan=0.0)latexify(columns=2)plt.plot(x_values, y_values, color='black')
# Set labels and title
plt.xlabel('$P(+)$')
plt.ylabel('Entropy')
plt.title('Entropy vs. $P(+)$')
format_axes(plt.gca())
plt.savefig("../figures/decision-trees/entropy.pdf", bbox_inches="tight")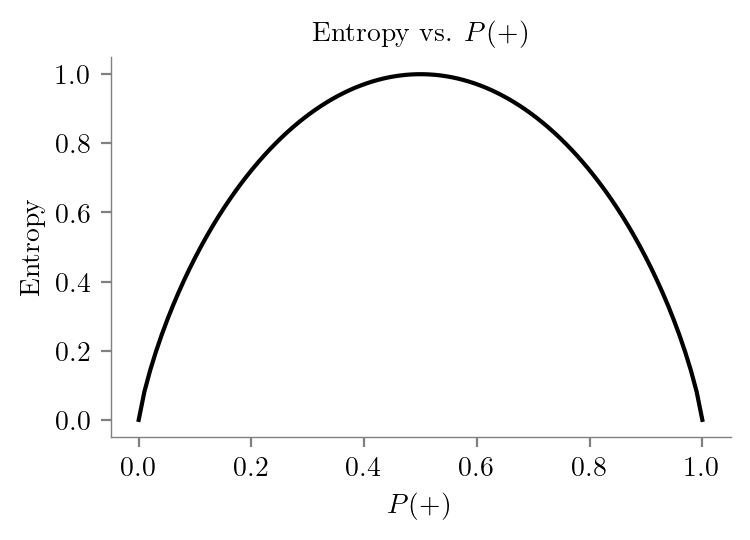
# Function to calculate entropy with numerical stability
def entropy_numerically_stable(p):
    return (-xlogy(p, p) - xlogy(1 - p, 1 - p))/np.log(2)

y_values = entropy_numerically_stable(x_values)
plt.plot(x_values, y_values)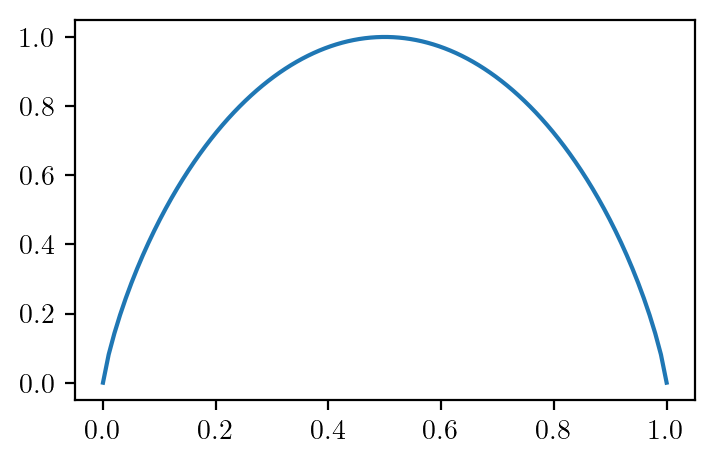
How does xlogy handle the corner case?
xlogy??Call signature: xlogy(*args, **kwargs) Type: ufunc String form: <ufunc 'xlogy'> File: ~/miniconda3/lib/python3.9/site-packages/numpy/__init__.py Docstring: xlogy(x1, x2, /, out=None, *, where=True, casting='same_kind', order='K', dtype=None, subok=True[, signature, extobj]) xlogy(x, y, out=None) Compute ``x*log(y)`` so that the result is 0 if ``x = 0``. Parameters ---------- x : array_like Multiplier y : array_like Argument out : ndarray, optional Optional output array for the function results Returns ------- z : scalar or ndarray Computed x*log(y) Notes ----- The log function used in the computation is the natural log. .. versionadded:: 0.13.0 Examples -------- We can use this function to calculate the binary logistic loss also known as the binary cross entropy. This loss function is used for binary classification problems and is defined as: .. math:: L = 1/n * \sum_{i=0}^n -(y_i*log(y\_pred_i) + (1-y_i)*log(1-y\_pred_i)) We can define the parameters `x` and `y` as y and y_pred respectively. y is the array of the actual labels which over here can be either 0 or 1. y_pred is the array of the predicted probabilities with respect to the positive class (1). >>> import numpy as np >>> from scipy.special import xlogy >>> y = np.array([0, 1, 0, 1, 1, 0]) >>> y_pred = np.array([0.3, 0.8, 0.4, 0.7, 0.9, 0.2]) >>> n = len(y) >>> loss = -(xlogy(y, y_pred) + xlogy(1 - y, 1 - y_pred)).sum() >>> loss /= n >>> loss 0.29597052165495025 A lower loss is usually better as it indicates that the predictions are similar to the actual labels. In this example since our predicted probabilties are close to the actual labels, we get an overall loss that is reasonably low and appropriate. Class docstring: Functions that operate element by element on whole arrays. To see the documentation for a specific ufunc, use `info`. For example, ``np.info(np.sin)``. Because ufuncs are written in C (for speed) and linked into Python with NumPy's ufunc facility, Python's help() function finds this page whenever help() is called on a ufunc. A detailed explanation of ufuncs can be found in the docs for :ref:`ufuncs`. **Calling ufuncs:** ``op(*x[, out], where=True, **kwargs)`` Apply `op` to the arguments `*x` elementwise, broadcasting the arguments. The broadcasting rules are: * Dimensions of length 1 may be prepended to either array. * Arrays may be repeated along dimensions of length 1. Parameters ---------- *x : array_like Input arrays. out : ndarray, None, or tuple of ndarray and None, optional Alternate array object(s) in which to put the result; if provided, it must have a shape that the inputs broadcast to. A tuple of arrays (possible only as a keyword argument) must have length equal to the number of outputs; use None for uninitialized outputs to be allocated by the ufunc. where : array_like, optional This condition is broadcast over the input. At locations where the condition is True, the `out` array will be set to the ufunc result. Elsewhere, the `out` array will retain its original value. Note that if an uninitialized `out` array is created via the default ``out=None``, locations within it where the condition is False will remain uninitialized. **kwargs For other keyword-only arguments, see the :ref:`ufunc docs <ufuncs.kwargs>`. Returns ------- r : ndarray or tuple of ndarray `r` will have the shape that the arrays in `x` broadcast to; if `out` is provided, it will be returned. If not, `r` will be allocated and may contain uninitialized values. If the function has more than one output, then the result will be a tuple of arrays.