import numpy as np
import matplotlib.pyplot as plt
%matplotlib inline
%config InlineBackend.figure_format = 'retina'Linear Regression: Geometric Perspective
Linear Regression Geometric Perspective
# Two three-dimensional vectors
v1 = np.array([1, 1, 1])
v2 = np.array([2, -2, 2])

# y-vector
y = np.array([2.5, -0.8, 1.2])
# plot the vectors in 3D
fig = plt.figure(figsize=(8, 8))
ax = fig.add_subplot(111, projection='3d')
ax.quiver(0, 0, 0, v1[0], v1[1], v1[2], color='r', label='v1')
ax.quiver(0, 0, 0, v2[0], v2[1], v2[2], color='b', label='v2')
ax.quiver(0, 0, 0, y[0], y[1], y[2], color='g', label='y')
ax.set_xlim(0, 3)
ax.set_ylim(0, 4)
ax.set_zlim(0, 3)
ax.set_xlabel('x')
ax.set_ylabel('y')
ax.set_zlabel('z')
ax.legend()
ax.view_init(elev=45, azim=60)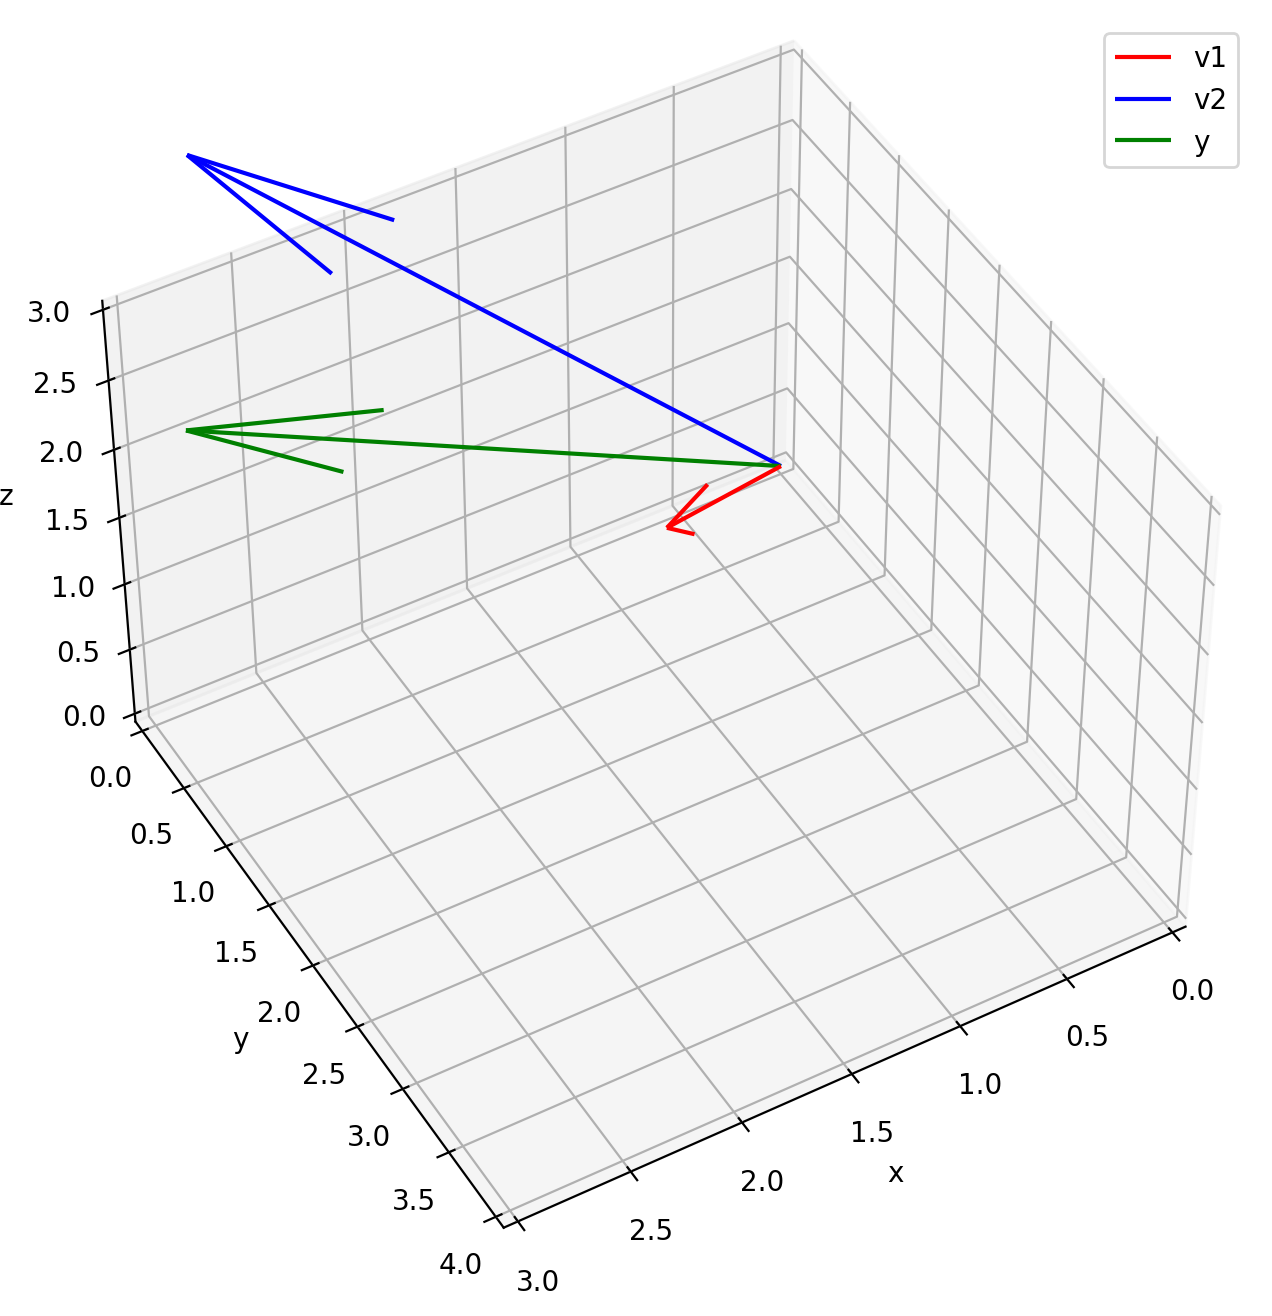
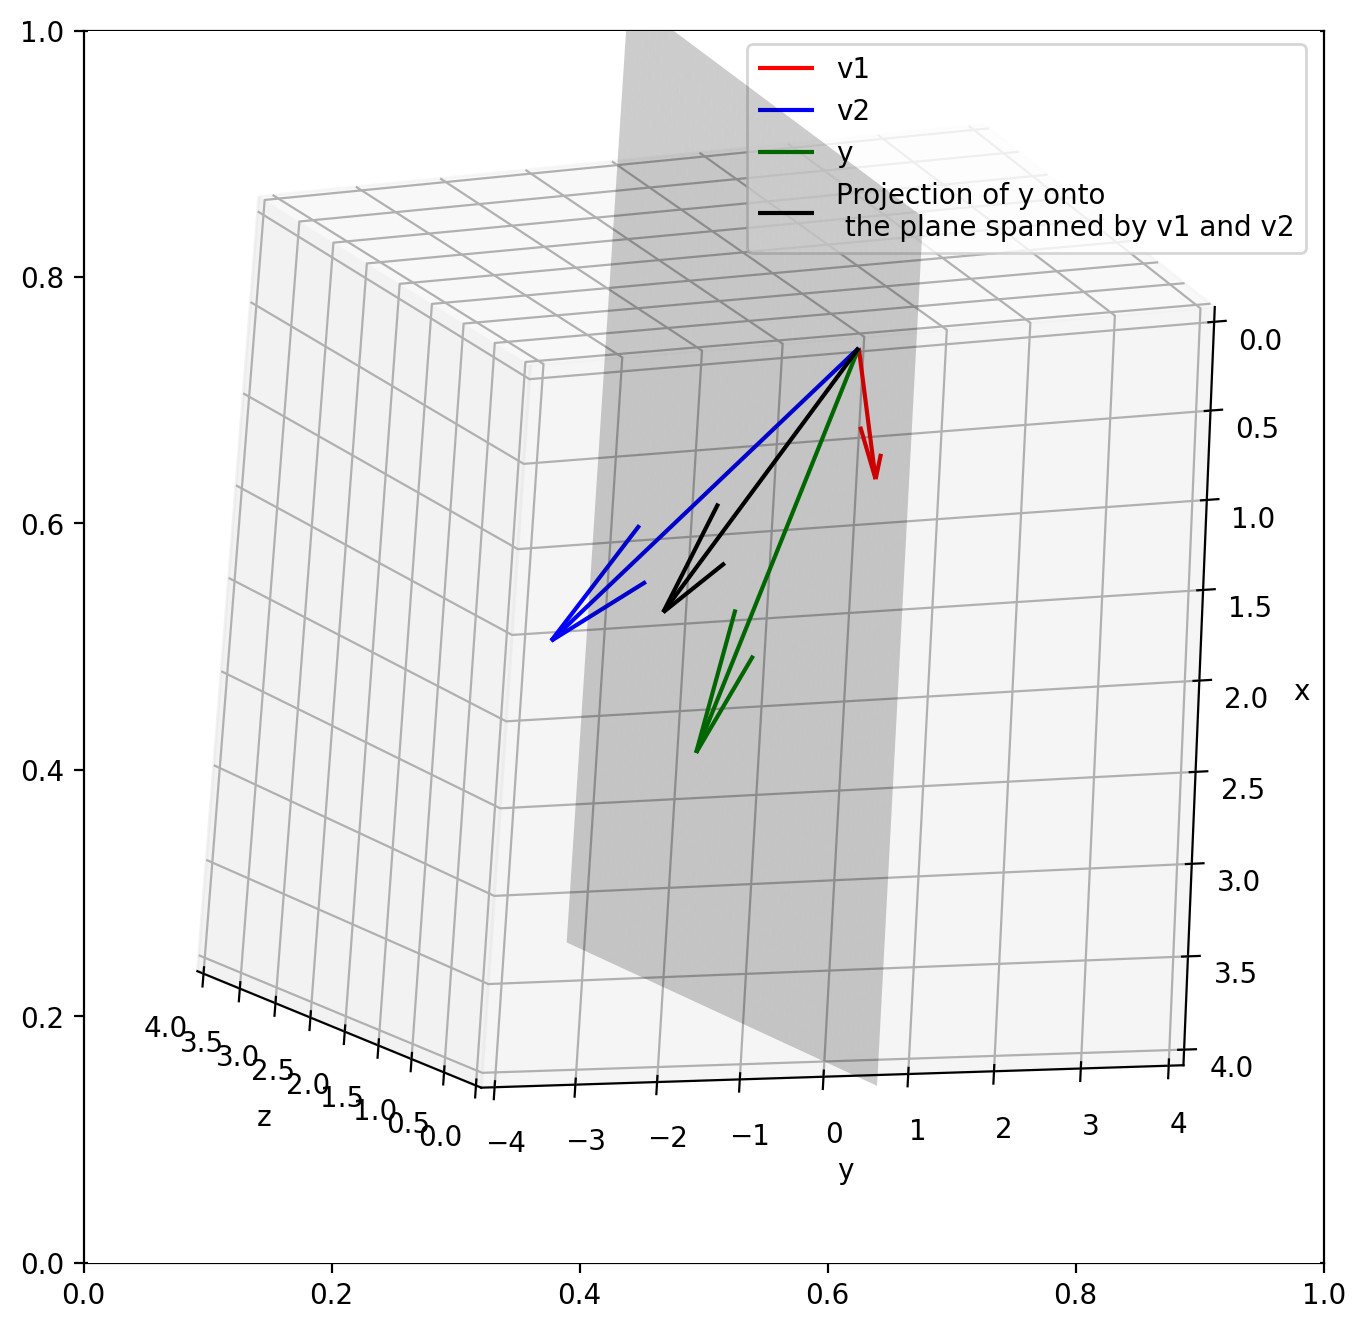
theta = np.linalg.lstsq(np.array([v1, v2]).T, y, rcond=None)[0]
theta
array([0.525 , 0.6625])# Projection of y onto the plane spanned by v1 and v2
y_proj = np.dot(np.array([v1, v2]).T, theta)
y_projarray([ 1.85, -0.8 , 1.85])# Plot the x=z plane filled with color black
fig, ax = plt.subplots(figsize=(8, 8))
# 3d projection
ax = fig.add_subplot(111, projection='3d')
xx, zz = np.meshgrid(np.linspace(-1, 4, 100), np.linspace(-1, 4, 100))
yy = np.zeros_like(xx)
ax.plot_surface(xx, yy, zz, alpha=0.2, color='k')
# plot the vectors in 3D
ax.quiver(0, 0, 0, v1[0], v1[1], v1[2], color='r', label='v1')
ax.quiver(0, 0, 0, v2[0], v2[1], v2[2], color='b', label='v2')
ax.quiver(0, 0, 0, y[0], y[1], y[2], color='g', label='y')
# Limit the view to the x-z plane
ax.set_xlabel('x')
ax.set_ylabel('y')
ax.set_zlabel('z')
# Set the view angle so that we can see the x-z plane appear at a 45 degree angle
#ax.view_init(azim=70, elev=200)
ax.view_init(elev=60, azim=-80, roll=90)
ax.view_init(120, -120, -120)
#ax.view_init(roll=45)
#ax.view_init(elev=30, azim=45, roll=15)
ax.set_ylim(-4, 4)
ax.set_xlim(0, 4)
ax.set_zlim(0, 4)
# Plot the projection of y onto the plane spanned by v1 and v2
ax.quiver(0, 0, 0, y_proj[0], y_proj[1], y_proj[2], color='k', label='Projection of y onto\n the plane spanned by v1 and v2')
plt.legend()<matplotlib.legend.Legend at 0x111d52730>