import numpy as np
import matplotlib.pyplot as plt
import pandas as pd

%matplotlib inline
%config InlineBackend.figure_format='retina'Dataset splitting for machine learning
Dataset splitting for machine learning
# Create a dataset with 3 features and 1000 samples for a classification problem

df = pd.DataFrame(np.random.randn(1000, 3), columns=['A', 'B', 'C'])
df['D'] = np.random.randint(0, 2, 1000)

df| A | B | C | D | |
|---|---|---|---|---|
| 0 | 0.112981 | -0.033889 | 0.348708 | 1 |
| 1 | 1.821601 | 1.267423 | 0.274915 | 1 |
| 2 | 0.148040 | -1.412712 | -0.271345 | 1 |
| 3 | 0.004766 | -1.209944 | 0.122512 | 1 |
| 4 | 0.854442 | -0.559497 | -0.605376 | 1 |
| ... | ... | ... | ... | ... |
| 995 | 0.161444 | -0.969567 | -2.079664 | 0 |
| 996 | 1.615938 | 0.219218 | -0.322223 | 0 |
| 997 | 0.501970 | -0.874313 | 1.571102 | 1 |
| 998 | 0.386063 | -1.481215 | -1.974313 | 1 |
| 999 | 0.468528 | 1.060850 | 0.612252 | 1 |
1000 rows × 4 columns
X, y = df[['A', 'B', 'C']], df['D']train_X, test_X = X[:800], X[800:]
train_y, test_y = y[:800], y[800:]from sklearn.tree import DecisionTreeClassifierdt = DecisionTreeClassifier(max_depth=2)
dt.fit(train_X, train_y)DecisionTreeClassifier(max_depth=2)In a Jupyter environment, please rerun this cell to show the HTML representation or trust the notebook.
On GitHub, the HTML representation is unable to render, please try loading this page with nbviewer.org.
DecisionTreeClassifier(max_depth=2)
from sklearn import tree
tree.plot_tree(dt)
[Text(0.5, 0.8333333333333334, 'X[0] <= -0.17\ngini = 0.5\nsamples = 800\nvalue = [400, 400]'),
Text(0.25, 0.5, 'X[0] <= -0.307\ngini = 0.495\nsamples = 348\nvalue = [157, 191]'),
Text(0.125, 0.16666666666666666, 'gini = 0.499\nsamples = 316\nvalue = [153, 163]'),
Text(0.375, 0.16666666666666666, 'gini = 0.219\nsamples = 32\nvalue = [4, 28]'),
Text(0.75, 0.5, 'X[2] <= 1.656\ngini = 0.497\nsamples = 452\nvalue = [243, 209]'),
Text(0.625, 0.16666666666666666, 'gini = 0.495\nsamples = 434\nvalue = [239, 195]'),
Text(0.875, 0.16666666666666666, 'gini = 0.346\nsamples = 18\nvalue = [4, 14]')]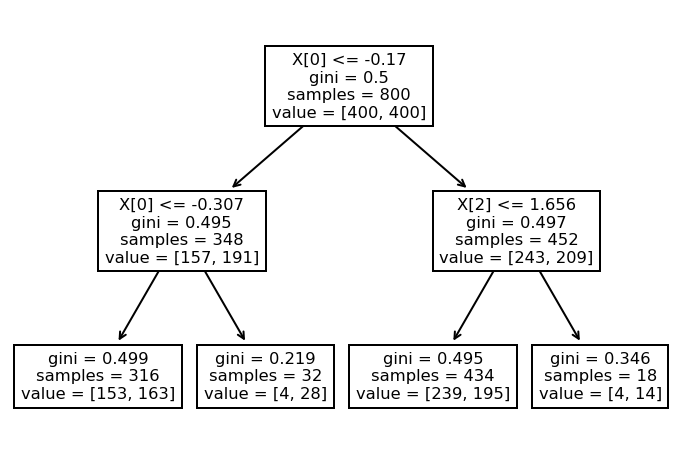
y_hat = dt.predict(test_X)
pd.DataFrame({"y_true": test_y, "y_hat": y_hat})| y_true | y_hat | |
|---|---|---|
| 800 | 0 | 1 |
| 801 | 0 | 0 |
| 802 | 1 | 1 |
| 803 | 1 | 1 |
| 804 | 0 | 1 |
| ... | ... | ... |
| 995 | 0 | 1 |
| 996 | 0 | 0 |
| 997 | 1 | 0 |
| 998 | 1 | 1 |
| 999 | 1 | 1 |
200 rows × 2 columns
from sklearn.tree import DecisionTreeClassifier
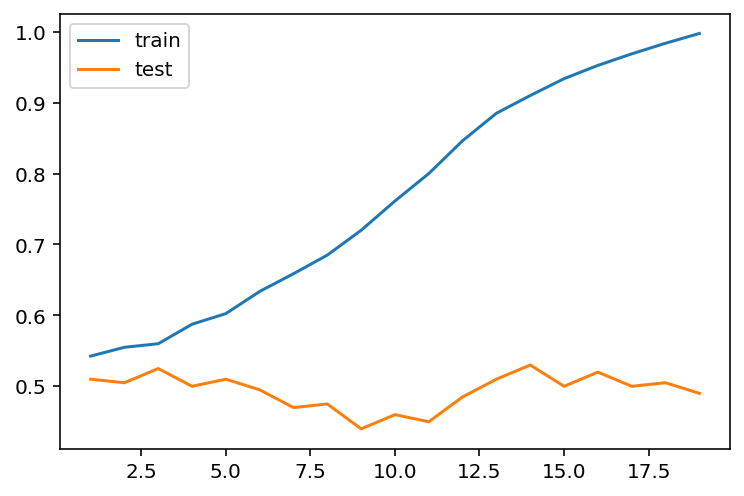
train_scores = {}
test_scores = {}
for i in range(1, 20):
dt = DecisionTreeClassifier(max_depth=i)
dt.fit(train_X, train_y)
train_scores[i] = dt.score(train_X, train_y)
test_scores[i] = dt.score(test_X, test_y)scores_df = pd.DataFrame({'train': train_scores, 'test': test_scores})
scores_df.plot()<AxesSubplot:>