import numpy as np
import pandas as pd
import matplotlib.pyplot as plt
from matplotlib import cm
%matplotlib inlineSVM with RBF kernel Gamma Factor
SVM with RBF kernel Gamma Factor
X = np.array([
    [0, 0],
    [-1, 0],
    [1, 0],
    [0, 1],
    [0, -1],
    [-2, 0],
    [2, 0],
    [0, -2],
    [0, 2]
])
y = np.array([1, 1, 1, 1, 1, -1, -1, -1, -1])
plt.scatter(X[:, 0], X[:, 1], c=y, cmap=cm.Paired)
plt.gca().set_aspect('equal')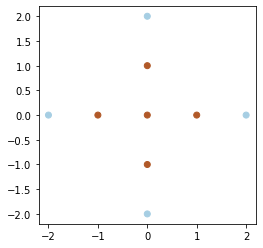
import pandas as pd

df = pd.DataFrame(X, columns=['x1', 'x2'])
df['y'] = y
df| x1 | x2 | y | |
|---|---|---|---|
| 0 | 0 | 0 | 1 |
| 1 | -1 | 0 | 1 |
| 2 | 1 | 0 | 1 |
| 3 | 0 | 1 | 1 |
| 4 | 0 | -1 | 1 |
| 5 | -2 | 0 | -1 |
| 6 | 2 | 0 | -1 |
| 7 | 0 | -2 | -1 |
| 8 | 0 | 2 | -1 |
from sklearn.metrics.pairwise import rbf_kernel
import seaborn as sns

gamma = 0.1  # parameter for RBF kernel
K = rbf_kernel(X, gamma=gamma)
sns.heatmap(K, annot=True, cmap=cm.viridis)
<AxesSubplot:>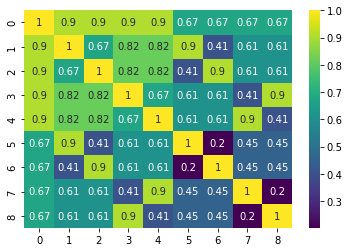
gammas = [0.01, 0.1, 1]
fig, axes = plt.subplots(1, 3, figsize=(16, 4))
for ax, gamma in zip(axes.ravel(), gammas):
    K = rbf_kernel(X, gamma=gamma)
    # Annotate to 1 decimal digit and use min = 0.0 and max =1.0
    sns.heatmap(K, annot=True, cmap=cm.viridis, ax=ax, fmt='.1f', vmin=0.0, vmax=1.0)
    ax.set_title('gamma = {}'.format(gamma))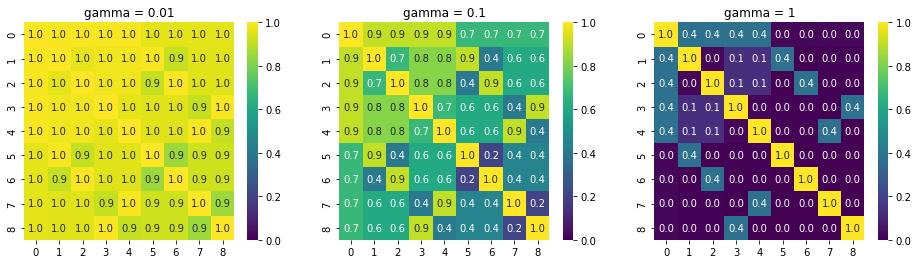
# Compare with the linear kernel
from sklearn.metrics.pairwise import linear_kernel, polynomial_kernel

K = linear_kernel(X)
sns.heatmap(K, annot=True, cmap=cm.viridis, fmt='.1f')
<AxesSubplot:>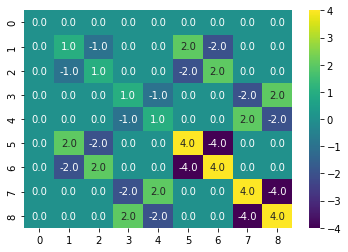
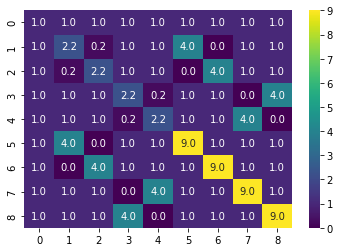
# Compare with the polynomial kernel
K = polynomial_kernel(X, degree=2)
sns.heatmap(K, annot=True, cmap=cm.viridis, fmt='.1f')
<AxesSubplot:>