import numpy as np
import pandas as pd
import matplotlib.pyplot as plt
from matplotlib import cm
%matplotlib inlineSVM
SVM
# Linearly separable data in 2d

# Generate data
np.random.seed(0)
X = np.r_[np.random.randn(20, 2) - [2, 2], np.random.randn(20, 2) + [2, 2]]
y = [0] * 20 + [1] * 20

# Plot data
plt.scatter(X[:, 0], X[:, 1], c=y, cmap=cm.Paired)
<matplotlib.collections.PathCollection at 0x7f8db31dea00>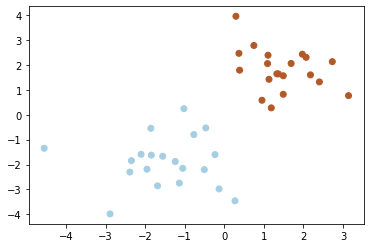
# Fit SVM
from sklearn.svm import SVC
clf = SVC(kernel='linear')
clf.fit(X, y)

# Plot decision boundary
w = clf.coef_[0]
a = -w[0] / w[1]
xx = np.linspace(-5, 5)
yy = a * xx - (clf.intercept_[0]) / w[1]
plt.plot(xx, yy, 'k-')

# Plot support vectors
plt.scatter(clf.support_vectors_[:, 0], clf.support_vectors_[:, 1], s=80, facecolors='none')

# Plot margins
b = clf.support_vectors_[0]
yy_down = a * xx + (b[1] - a * b[0])
b = clf.support_vectors_[-1]
yy_up = a * xx + (b[1] - a * b[0])
plt.plot(xx, yy_down, 'k--')
plt.plot(xx, yy_up, 'k--')

# Plot data
plt.scatter(X[:, 0], X[:, 1], c=y, cmap=cm.Paired)
<matplotlib.collections.PathCollection at 0x7f8b940742b0>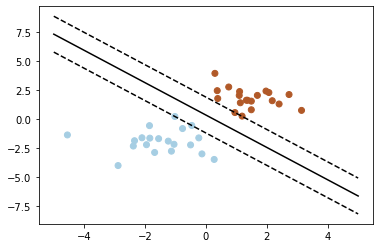
# Magnitude of w
np.linalg.norm(w)
1.111010607589106