8.1.5Interactive Data Exploration with Jupyter Widgets
Data Science
Interactive Computing
Data Visualization
Python
Interactive data exploration and visualization using Jupyter widgets with pandas and matplotlib
Keywords
jupyter widgets, interactive computing, data filtering, visualization, pandas, matplotlib, ipywidgets
Interactive Data Exploration with Jupyter Widgets
Introduction
This notebook demonstrates the power of Jupyter widgets for creating interactive data exploration experiences. Widgets allow us to build dynamic interfaces directly within Jupyter notebooks, making data analysis more engaging and intuitive.
Learning Objectives
By the end of this notebook, you will understand: - How to use ipywidgets for interactive data filtering - Creating interactive visualizations with @interact decorator - Building custom widget interfaces for data exploration - Combining widgets with pandas for dynamic data analysis - Best practices for interactive notebook design
Prerequisites
- Basic understanding of pandas and matplotlib
- Familiarity with Jupyter notebooks
- Basic Python programming concepts
Why Use Interactive Widgets?
Interactive widgets provide several advantages: 1. Immediate Feedback: See results change in real-time as you modify parameters 2. Enhanced Exploration: Easily test different scenarios without rewriting code 3. Better Communication: Make presentations and demos more engaging 4. Reduced Code Repetition: One function can handle multiple parameter combinations
Setup and Data Preparation
Let’s start by importing the necessary libraries and creating a sample student dataset for our interactive exploration.
names = [
    'Aarav', 'Aditi', 'Arjun', 'Ananya', 'Dhruv', 'Diya',
    'Ishaan', 'Isha', 'Krishna', 'Kavya', 'Mira', 'Mihir',
    'Neha', 'Nikhil', 'Priya', 'Pranav', 'Riya', 'Rohan'
]

df = pd.DataFrame({
    'Name': names,
    'Age': np.random.randint(18, 23, len(names)),
    'Grade': np.random.randint(65, 100, len(names)),
    'Subject': np.random.choice(['Math', 'Physics', 'Chemistry'], len(names))
})
Creating Sample Student Data
We’ll create a realistic student dataset with multiple attributes to demonstrate various filtering capabilities.
| Name | Age | Grade | Subject | |
|---|---|---|---|---|
| 0 | Aarav | 20 | 69 | Chemistry |
| 1 | Aditi | 21 | 68 | Physics |
| 2 | Arjun | 19 | 72 | Physics |
| 3 | Ananya | 21 | 65 | Chemistry |
| 4 | Dhruv | 20 | 75 | Physics |
| 5 | Diya | 21 | 88 | Physics |
| 6 | Ishaan | 22 | 84 | Math |
| 7 | Isha | 18 | 99 | Math |
| 8 | Krishna | 19 | 77 | Chemistry |
| 9 | Kavya | 21 | 87 | Physics |
| 10 | Mira | 21 | 69 | Chemistry |
| 11 | Mihir | 19 | 77 | Chemistry |
| 12 | Neha | 18 | 66 | Math |
| 13 | Nikhil | 18 | 78 | Physics |
| 14 | Priya | 22 | 89 | Physics |
| 15 | Pranav | 20 | 99 | Math |
| 16 | Riya | 18 | 84 | Math |
| 17 | Rohan | 21 | 65 | Physics |
Basic Data Filtering Examples
Before diving into interactive widgets, let’s see some traditional filtering approaches to understand what we’re trying to make interactive.
Simple Interactive Filtering with @interact
The @interact decorator is the simplest way to create interactive widgets. It automatically generates appropriate widgets based on the function parameters.
Showing All students with grade >= 0.0| Name | Age | Grade | Subject | |
|---|---|---|---|---|
| 0 | Aarav | 20 | 69 | Chemistry |
| 1 | Aditi | 21 | 68 | Physics |
| 2 | Arjun | 19 | 72 | Physics |
| 3 | Ananya | 21 | 65 | Chemistry |
| 4 | Dhruv | 20 | 75 | Physics |
| 5 | Diya | 21 | 88 | Physics |
| 6 | Ishaan | 22 | 84 | Math |
| 7 | Isha | 18 | 99 | Math |
| 8 | Krishna | 19 | 77 | Chemistry |
| 9 | Kavya | 21 | 87 | Physics |
| 10 | Mira | 21 | 69 | Chemistry |
| 11 | Mihir | 19 | 77 | Chemistry |
| 12 | Neha | 18 | 66 | Math |
| 13 | Nikhil | 18 | 78 | Physics |
| 14 | Priya | 22 | 89 | Physics |
| 15 | Pranav | 20 | 99 | Math |
| 16 | Riya | 18 | 84 | Math |
| 17 | Rohan | 21 | 65 | Physics |
Advanced Interactive Filtering
Now let’s create a more sophisticated interface with multiple filter criteria. Notice how we can combine different widget types for a richer user experience.
def plot_wave(freq=1):
    """Basic plotting function"""
    x = np.linspace(-1*np.pi, 1*np.pi, 500)

    plt.plot(x, np.sin(np.pi*2*freq*x), label='sin(x)')
    plt.plot(x, np.cos(np.pi*2*freq*x), label='cos(x)')
    plt.grid(True)
    plt.legend()
    plt.title('Trigonometric Functions')
    plt.show()

print("\nBasic Plot (Direct Function Call):")
plot_wave()
Basic Plot (Direct Function Call):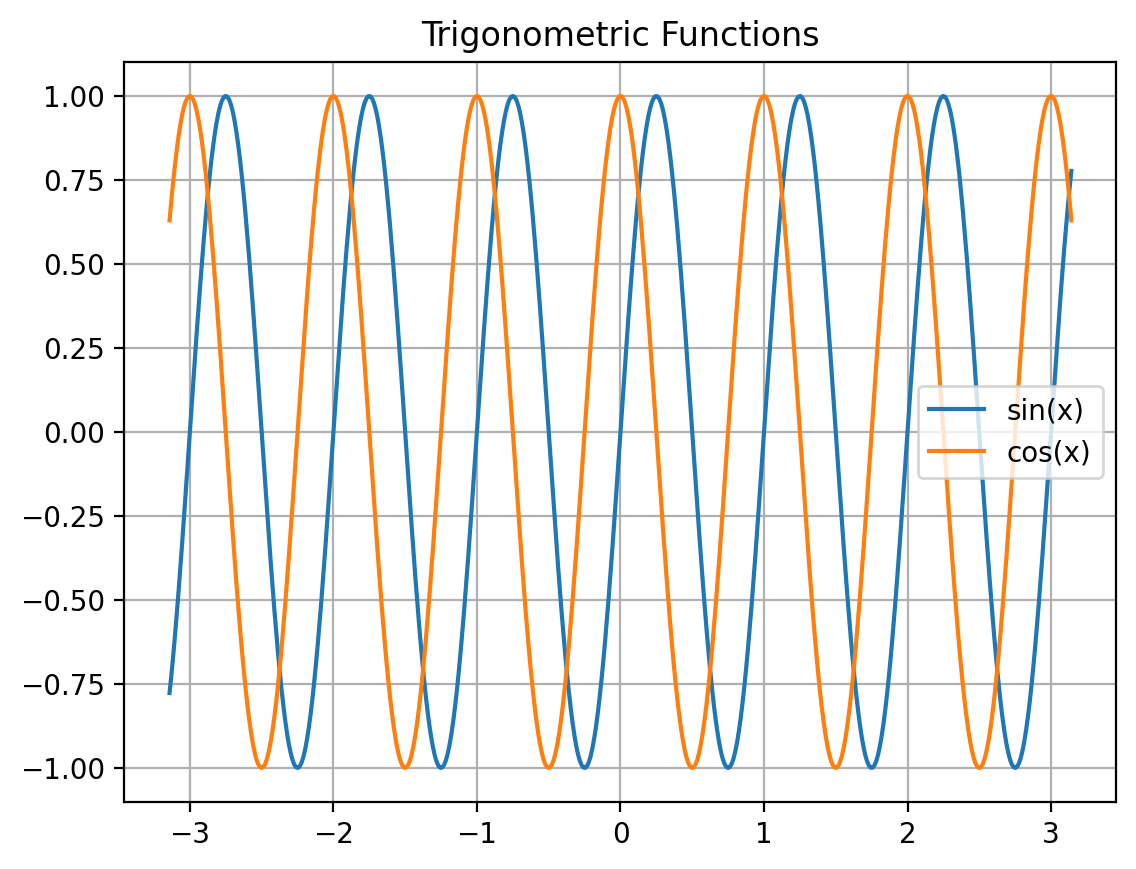
Interactive Data Visualization
Widgets aren’t just for filtering data - they’re also powerful for creating interactive visualizations. Let’s explore mathematical functions with interactive parameters.
print("\nPlotting with @interact:")

@interact
def plot_wave_interact(freq=(1, 5, 1)):
    """Simple interactive plotting with @interact"""
    plot_wave(freq)
Plotting with @interact:Simple Interactive Plotting
The @interact decorator makes it easy to create interactive plots with minimal code.
def plot_wave_advanced(func_type='sine', frequency=1, color='blue', show_grid=True):
    """Advanced plotting with more control"""
    fig, ax = plt.subplots(figsize=(6, 4))

    num_points = 1000

    x = np.linspace(-2 * np.pi, 2 * np.pi, num_points)

    if func_type == 'sine':
        y = np.sin(2 * np.pi * frequency * x)
        title = 'Sine Wave'
    elif func_type == 'cosine':
        y = np.cos(2 * np.pi * frequency * x)
        title = 'Cosine Wave'

    plt.plot(x, y, color=color, label=func_type)
    plt.title(title)
    plt.legend()
    plt.grid(show_grid)

    plt.show()

# Create the interact widget and store it in plot_viz
plot_viz = interact(
    plot_wave_advanced,
    func_type=widgets.RadioButtons(
        options=['sine', 'cosine'],
        description='Function:',
        style={'description_width': 'initial'},
        layout={'width': '200px'}
    ),
    frequency=widgets.FloatSlider(
        value=1,
        min=0.1,
        max=5,
        step=0.1,
        description='Frequency:',
        style={'description_width': 'initial'},
        layout={'width': '300px'}
    ),
    color=widgets.Dropdown(
        options=['blue', 'red', 'green', 'purple'],
        value='blue',
        description='Color:',
        style={'description_width': 'initial'},
        layout={'width': '200px'}
    ),
    show_grid=widgets.Checkbox(
        value=True,
        description='Show Grid',
        style={'description_width': 'initial'}
    )
)
Advanced Widget Customization
For more control over the interface, we can explicitly define widget types and their properties. This gives us fine-grained control over the user experience.
Key Takeaways and Best Practices
What We’ve Learned
- Simple Interactivity: The
@interactdecorator provides quick interactive capabilities - Custom Widgets: Explicit widget definitions offer more control over user interface
- Real-time Updates: Widgets provide immediate feedback for data exploration
- Multiple Widget Types: Different widgets (sliders, dropdowns, checkboxes) serve different purposes
Best Practices for Interactive Widgets
- Start Simple: Begin with
@interactand add complexity as needed - Meaningful Parameters: Choose parameters that significantly affect results
- Reasonable Ranges: Set appropriate min/max values for sliders
- Clear Labels: Use descriptive names for widget labels
- Performance: Be mindful of computational cost for real-time updates
Common Widget Types
- IntSlider/FloatSlider: For numeric ranges
- Dropdown: For categorical selections
- RadioButtons: For mutually exclusive choices
- Checkbox: For boolean options
- Text: For string input
Real-World Applications
Interactive widgets are valuable for: - Parameter Tuning: Machine learning hyperparameter optimization - Data Exploration: Quick filtering and subsetting of datasets - Educational Content: Teaching concepts with interactive examples - Dashboards: Creating simple analytical interfaces - Prototyping: Rapid development of interactive tools
Next Steps
To extend your widget skills: 1. Explore advanced layout options with HBox and VBox 2. Learn about widget events and callbacks 3. Investigate integration with other visualization libraries (Plotly, Bokeh) 4. Consider building full dashboard applications with Voila