## Visualize Training Progress
fig, axes = plt.subplots(2, 2, figsize=(14, 10))
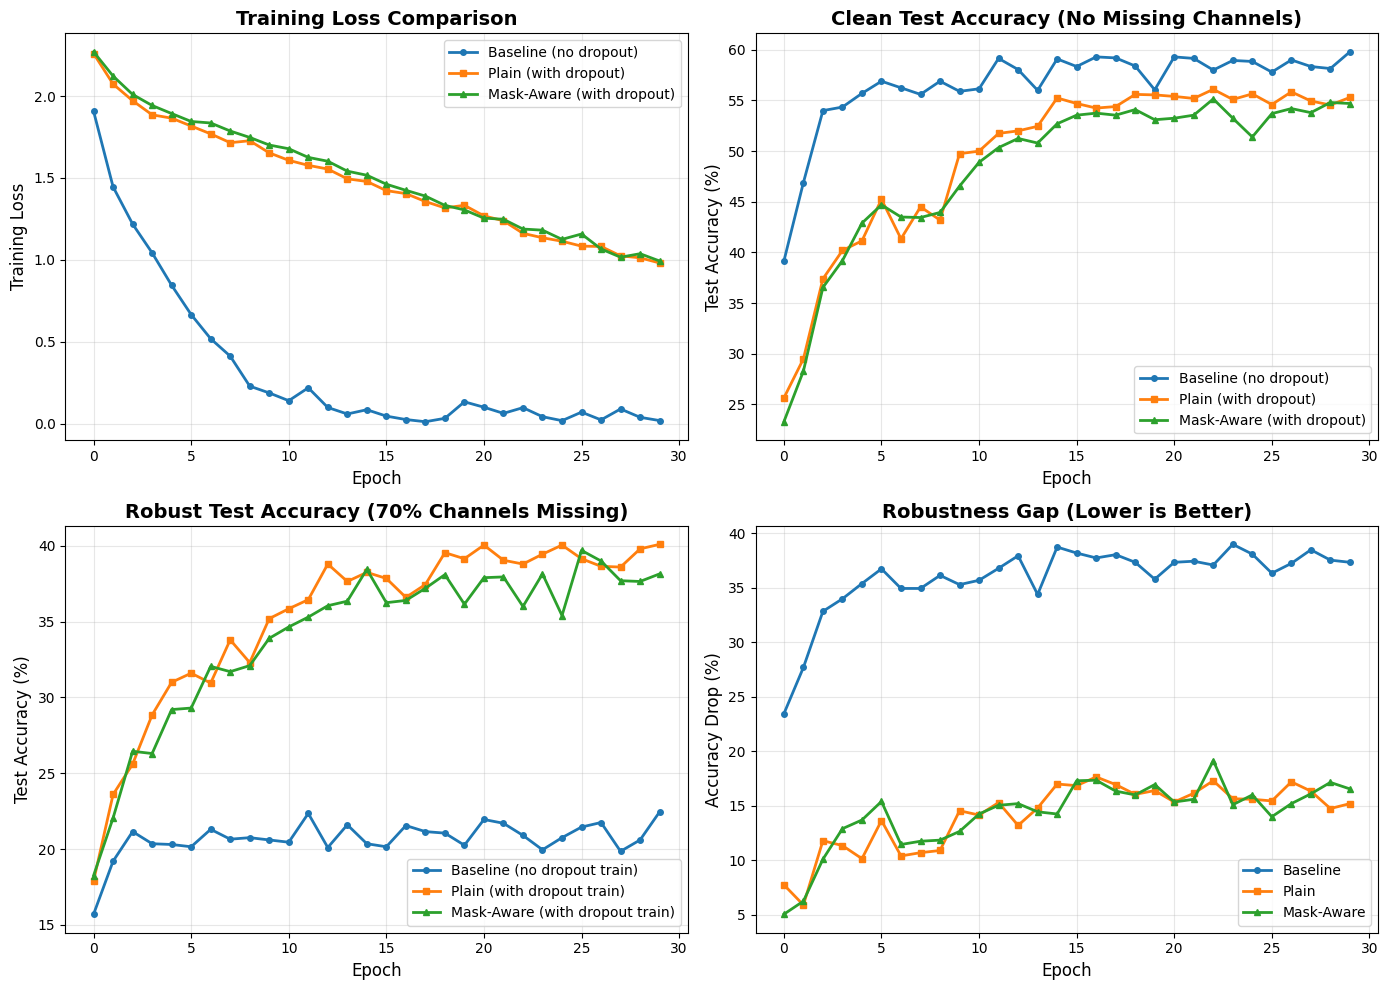
# Plot training loss
axes[0, 0].plot(train_losses_nodrop, 'o-', label='Baseline (no dropout)', linewidth=2, markersize=4)
axes[0, 0].plot(train_losses_plain, 's-', label='Plain (with dropout)', linewidth=2, markersize=4)
axes[0, 0].plot(train_losses_masked, '^-', label='Mask-Aware (with dropout)', linewidth=2, markersize=4)
axes[0, 0].set_xlabel('Epoch', fontsize=12)
axes[0, 0].set_ylabel('Training Loss', fontsize=12)
axes[0, 0].set_title('Training Loss Comparison', fontsize=14, fontweight='bold')
axes[0, 0].legend(fontsize=10)
axes[0, 0].grid(True, alpha=0.3)
# Plot clean test accuracy (no dropout at test time)
axes[0, 1].plot(test_accs_nodrop, 'o-', label='Baseline (no dropout)', linewidth=2, markersize=4)
axes[0, 1].plot(test_accs_plain, 's-', label='Plain (with dropout)', linewidth=2, markersize=4)
axes[0, 1].plot(test_accs_masked, '^-', label='Mask-Aware (with dropout)', linewidth=2, markersize=4)
axes[0, 1].set_xlabel('Epoch', fontsize=12)
axes[0, 1].set_ylabel('Test Accuracy (%)', fontsize=12)
axes[0, 1].set_title('Clean Test Accuracy (No Missing Channels)', fontsize=14, fontweight='bold')
axes[0, 1].legend(fontsize=10)
axes[0, 1].grid(True, alpha=0.3)
# Plot robust test accuracy (WITH dropout at test time)
axes[1, 0].plot(test_accs_nodrop_dropped, 'o-', label='Baseline (no dropout train)', linewidth=2, markersize=4)
axes[1, 0].plot(test_accs_plain_dropped, 's-', label='Plain (with dropout train)', linewidth=2, markersize=4)
axes[1, 0].plot(test_accs_masked_dropped, '^-', label='Mask-Aware (with dropout train)', linewidth=2, markersize=4)
axes[1, 0].set_xlabel('Epoch', fontsize=12)
axes[1, 0].set_ylabel('Test Accuracy (%)', fontsize=12)
axes[1, 0].set_title(f'Robust Test Accuracy ({p_drop*100:.0f}% Channels Missing)', fontsize=14, fontweight='bold')
axes[1, 0].legend(fontsize=10)
axes[1, 0].grid(True, alpha=0.3)
# Plot robustness gap (Clean - Robust)
gap_nodrop = [c - r for c, r in zip(test_accs_nodrop, test_accs_nodrop_dropped)]
gap_plain = [c - r for c, r in zip(test_accs_plain, test_accs_plain_dropped)]
gap_masked = [c - r for c, r in zip(test_accs_masked, test_accs_masked_dropped)]
axes[1, 1].plot(gap_nodrop, 'o-', label='Baseline', linewidth=2, markersize=4)
axes[1, 1].plot(gap_plain, 's-', label='Plain', linewidth=2, markersize=4)
axes[1, 1].plot(gap_masked, '^-', label='Mask-Aware', linewidth=2, markersize=4)
axes[1, 1].set_xlabel('Epoch', fontsize=12)
axes[1, 1].set_ylabel('Accuracy Drop (%)', fontsize=12)
axes[1, 1].set_title('Robustness Gap (Lower is Better)', fontsize=14, fontweight='bold')
axes[1, 1].legend(fontsize=10)
axes[1, 1].grid(True, alpha=0.3)
plt.tight_layout()
plt.show()
print(f"\n{'='*70}")
print(f"FINAL RESULTS (Epoch {num_epochs}):")
print(f"{'='*70}")
print(f"\n{'Model':<25} {'Clean Acc':<12} {'Robust Acc':<12} {'Gap':<10}")
print(f"{'-'*70}")
print(f"{'Baseline (no dropout)':<25} {test_accs_nodrop[-1]:>10.2f}% {test_accs_nodrop_dropped[-1]:>10.2f}% {gap_nodrop[-1]:>8.2f}%")
print(f"{'Plain (with dropout)':<25} {test_accs_plain[-1]:>10.2f}% {test_accs_plain_dropped[-1]:>10.2f}% {gap_plain[-1]:>8.2f}%")
print(f"{'Mask-Aware (with dropout)':<25} {test_accs_masked[-1]:>10.2f}% {test_accs_masked_dropped[-1]:>10.2f}% {gap_masked[-1]:>8.2f}%")
print(f"\n{'='*70}")
print(f"Key Insight: Mask-Aware should have the SMALLEST gap (most robust)")
print(f"{'='*70}")