# Install required packages
# Uncomment the line below to install dependencies
# !pip install -q google-genai pillow requests matplotlib pandas numpyMultimodal AI models can understand and generate content across different types of data—text, images, video, audio, and documents—through a unified interface. This notebook explores these capabilities using Google’s Gemini API as a practical example.
We demonstrate core capabilities like text understanding, visual reasoning, and cross-modal tasks. The examples progress from fundamental operations to more advanced applications like object detection with bounding boxes, image segmentation, and solving mathematical problems from images.

Example: Detecting a cat with polygon outline and segmentation overlay - one of the advanced vision tasks demonstrated in this notebook
Each example is designed to be immediately runnable and applicable to real-world use cases.
Setup and Configuration
First, install the required packages and set up your Gemini API key.
Get Your API Key
- Visit Google AI Studio
- Create or select a project
- Generate an API key
- Set it as an environment variable:
export GEMINI_API_KEY='your-api-key-here'import os
import json
import time
from pathlib import Path
from typing import List, Dict, Any
from google import genai
from PIL import Image, ImageDraw, ImageFont
import requests
from io import BytesIO
import base64
import matplotlib.pyplot as plt
import numpy as np
# Check for API key
if 'GEMINI_API_KEY' not in os.environ:
raise ValueError(
"GEMINI_API_KEY not found in environment.\n"
"Set it with: export GEMINI_API_KEY='your-key'\n"
"Get your key at: https://aistudio.google.com/apikey"
)
# Initialize client (new SDK)
client = genai.Client(api_key=os.environ['GEMINI_API_KEY'])
print(" Gemini client initialized successfully")
print("Using google-genai SDK (new version)")
# Note: We'll use gemini-3-pro as the default model
MODEL = "models/gemini-3-pro-preview"
print(f"Default model: {MODEL}")
IMAGE_MODEL = "models/gemini-3-pro-image-preview"
print(f"Image model: {IMAGE_MODEL}")
%config InlineBackend.figure_format = 'retina' # High-res plots Gemini client initialized successfully
Using google-genai SDK (new version)
Default model: models/gemini-3-pro-preview
Image model: models/gemini-3-pro-image-preview# List all available models
print("Available Gemini models:")
print("="*80)
for model in client.models.list():
if 'gemini' in model.name.lower():
print(f" - {model.name}")
print("\n" + "="*80)Available Gemini models:
================================================================================
- models/gemini-2.5-flash
- models/gemini-2.5-pro
- models/gemini-2.0-flash-exp
- models/gemini-2.0-flash
- models/gemini-2.0-flash-001
- models/gemini-2.0-flash-exp-image-generation
- models/gemini-2.0-flash-lite-001
- models/gemini-2.0-flash-lite
- models/gemini-2.0-flash-lite-preview-02-05
- models/gemini-2.0-flash-lite-preview
- models/gemini-2.0-pro-exp
- models/gemini-2.0-pro-exp-02-05
- models/gemini-exp-1206
- models/gemini-2.5-flash-preview-tts
- models/gemini-2.5-pro-preview-tts
- models/gemini-flash-latest
- models/gemini-flash-lite-latest
- models/gemini-pro-latest
- models/gemini-2.5-flash-lite
- models/gemini-2.5-flash-image-preview
- models/gemini-2.5-flash-image
- models/gemini-2.5-flash-preview-09-2025
- models/gemini-2.5-flash-lite-preview-09-2025
- models/gemini-3-pro-preview
- models/gemini-3-pro-image-preview
- models/gemini-robotics-er-1.5-preview
- models/gemini-2.5-computer-use-preview-10-2025
- models/gemini-embedding-exp-03-07
- models/gemini-embedding-exp
- models/gemini-embedding-001
- models/gemini-2.0-flash-live-001
- models/gemini-live-2.5-flash-preview
- models/gemini-2.5-flash-live-preview
- models/gemini-2.5-flash-native-audio-latest
- models/gemini-2.5-flash-native-audio-preview-09-2025
================================================================================Note: We’re using models/gemini-3-pro-preview - the latest Gemini 3 Pro model available via the API. This model delivers the state-of-the-art multimodal capabilities described in Google’s announcement.
Helper Functions
def print_section(title: str):
"""Print formatted section header."""
print("\n" + "="*80)
print(title)
print("="*80)
def print_result(label: str, content: str, indent: int = 0):
"""Print formatted result."""
prefix = " " * indent
print(f"{prefix}{label}: {content}")
def load_image_from_url(url: str) -> Image.Image:
"""Load an image from a URL."""
response = requests.get(url)
return Image.open(BytesIO(response.content))
def create_sample_image(text: str, size=(800, 600)) -> Image.Image:
"""Create a simple image with text for testing."""
img = Image.new('RGB', size, color='white')
draw = ImageDraw.Draw(img)
draw.text((50, size[1]//2), text, fill='black')
return img
print("Helper functions loaded")Helper functions loadedSingle Request vs Batch Processing
print("Single Request")
print("="*80)
# Single request - simplest way
response = client.models.generate_content(
model=MODEL,
contents="What is the capital of France?")
print_result("Question", "What is the capital of France?")
print_result("Answer", response.text)Single Request
================================================================================
Question: What is the capital of France?
Answer: The capital of France is **Paris**.print("\n" + "="*80)
print("Sequential processing:")
print("="*80)
# Process multiple prompts efficiently
prompts = [
"Translate 'Hello' to Spanish",
"Translate 'Goodbye' to French",
]
start = time.time()
results_seq = []
for prompt in prompts:
response = client.models.generate_content(
model=MODEL,
contents=prompt
)
results_seq.append(response.text.strip())
time_seq = time.time() - start
for i, (prompt, result) in enumerate(zip(prompts, results_seq), 1):
print(f" {i}. {prompt} → {result}")
print(f"Time: {time_seq:.2f}s")
================================================================================
Sequential processing:
================================================================================
1. Translate 'Hello' to Spanish → **Hola**
2. Translate 'Goodbye' to French → The most common and standard way to say "Goodbye" in French is:
**Au revoir**
(Pronounced: *oh vwah*)
However, depending on the context, here are other common variations:
**Casual (friends and family):**
* **Salut** (Used for both "Hi" and "Bye")
* **À plus** (Short for "See you later")
* **Ciao** (Borrowed from Italian, very common in France)
**Specific situations:**
* **À bientôt** (See you soon)
* **À demain** (See you tomorrow)
* **Bonne journée** (Have a good day — used when leaving someone during the daytime)
* **Bonne soirée** (Have a good evening — used when leaving someone at night)
**Permanent/Dramatic:**
* **Adieu** (Farewell — implies you will likely never see the person again)
Time: 15.34sText Understanding and NLP Tasks
While Gemini-3-Pro excels at multimodal tasks, it also delivers exceptional performance on pure text tasks. These examples demonstrate fundamental NLP capabilities:
Sentiment Analysis
print("\n" + "="*80)
print("Zero-Shot Sentiment Analysis")
print("="*80)
texts = [
"This product is absolutely amazing! Best purchase I've made all year.",
"Terrible experience. Waste of money and time.",
"It's okay. Nothing special but does the job.",
"I'm disappointed with the quality. Expected much better.",
"Exceeded all my expectations! Highly recommend!"
]
prompt_template = """Classify the sentiment: Positive, Negative, or Neutral.
Reply with ONLY the sentiment label.
Text: {text}
Sentiment:"""
for i, text in enumerate(texts, 1):
response = client.models.generate_content(
model=MODEL,
contents=prompt_template.format(text=text)
)
sentiment = response.text.strip()
print(f"{i}. '{text[:50]}...'")
print(f" → {sentiment}\n")
================================================================================
Zero-Shot Sentiment Analysis
================================================================================
1. 'This product is absolutely amazing! Best purchase ...'
→ Positive
2. 'Terrible experience. Waste of money and time....'
→ Negative
3. 'It's okay. Nothing special but does the job....'
→ Neutral
4. 'I'm disappointed with the quality. Expected much b...'
→ Negative
5. 'Exceeded all my expectations! Highly recommend!...'
→ Positive
Few-Shot Classification
print("\n" + "="*80)
print("Few-Shot Text Classification")
print("="*80)
# Intent classification with examples
prompt = """Classify customer service queries into categories.
Examples:
"How do I reset my password?" → Technical Support
"I was charged twice" → Billing
"What are your hours?" → General Inquiry
"This is broken" → Complaint
"I want to cancel" → Account Management
Query: "{query}"
Category:"""
test_queries = [
"My app keeps crashing when I upload photos",
"Why was I charged for premium when I'm on free plan?",
"Do you ship to Canada?",
"The product arrived damaged",
"How do I delete my account?"
]
for query in test_queries:
response = client.models.generate_content(
model=MODEL,
contents=prompt.format(query=query)
)
print(f"Query: {query}")
print(f"Category: {response.text.strip()}\n")
================================================================================
Few-Shot Text Classification
================================================================================
Query: My app keeps crashing when I upload photos
Category: Technical Support
Query: Why was I charged for premium when I'm on free plan?
Category: Billing
Query: Do you ship to Canada?
Category: **Shipping** (or **Shipping & Delivery**)
Query: The product arrived damaged
Category: Based on the examples provided, particularly the mapping of "This is broken" to **Complaint**, the most consistent category for a damaged product is:
Category: **Complaint**
*(Note: In a broader customer service system with more granular categories, this might also fall under "Returns & Exchanges" or "Shipping Issues".)*
Query: How do I delete my account?
Category: Account Management
Named Entity Recognition
print("\n" + "="*80)
print("Named Entity Recognition (NER)")
print("="*80)
text = """Apple Inc. CEO Tim Cook announced a $500 million investment in renewable
energy projects across California next month. The announcement was made at the
company's headquarters in Cupertino on December 15, 2024."""
prompt = f"""Extract all named entities and categorize them:
PERSON, ORGANIZATION, LOCATION, MONEY, DATE
Text: {text}
Format as JSON with entity type as key."""
response = client.models.generate_content(
model=MODEL,
contents=prompt)
print(f"Text: {text}\n")
print("Entities:")
print(response.text)
================================================================================
Named Entity Recognition (NER)
================================================================================
Text: Apple Inc. CEO Tim Cook announced a $500 million investment in renewable
energy projects across California next month. The announcement was made at the
company's headquarters in Cupertino on December 15, 2024.
Entities:
```json
{
"PERSON": [
"Tim Cook"
],
"ORGANIZATION": [
"Apple Inc."
],
"LOCATION": [
"California",
"Cupertino"
],
"MONEY": [
"$500 million"
],
"DATE": [
"next month",
"December 15, 2024"
]
}
```Text Summarization
print("\n" + "="*80)
print("Text Summarization")
print("="*80)
article = """Artificial intelligence continues to transform industries worldwide. Recent
advances in large language models have enabled more natural conversations between humans
and machines. These models can understand context, generate coherent text, and even
perform complex reasoning tasks. However, challenges remain in ensuring factual accuracy,
reducing computational costs, and addressing ethical concerns around bias and privacy.
Researchers are actively working on making AI more efficient, transparent, and aligned
with human values. The field is evolving rapidly, with new breakthroughs announced weekly.
From healthcare to education, AI is reshaping how we work and live."""
prompts = [
"Summarize in 1 sentence:",
"Summarize in 3 bullet points:",
"Create a tweet-length summary (280 chars):"
]
print(f"Original ({len(article)} chars):\n{article}\n")
for prompt_type in prompts:
response = client.models.generate_content(
model=MODEL,
contents=f"{prompt_type}\n\n{article}"
)
print(f"{prompt_type}")
print(f" {response.text.strip()}\n")
================================================================================
Text Summarization
================================================================================
Original (671 chars):
Artificial intelligence continues to transform industries worldwide. Recent
advances in large language models have enabled more natural conversations between humans
and machines. These models can understand context, generate coherent text, and even
perform complex reasoning tasks. However, challenges remain in ensuring factual accuracy,
reducing computational costs, and addressing ethical concerns around bias and privacy.
Researchers are actively working on making AI more efficient, transparent, and aligned
with human values. The field is evolving rapidly, with new breakthroughs announced weekly.
From healthcare to education, AI is reshaping how we work and live.
Summarize in 1 sentence:
While rapid advancements in large language models are transforming global industries and daily life with sophisticated capabilities, researchers continue to address critical challenges regarding accuracy, efficiency, and ethical standards.
Summarize in 3 bullet points:
Here is a 3-bullet point summary:
* **Technological Advancements:** Recent breakthroughs in large language models have enabled machines to perform complex reasoning, understand context, and engage in natural conversations.
* **Ongoing Challenges:** Despite progress, significant hurdles remain regarding factual accuracy, high computational costs, and ethical concerns related to bias and privacy.
* **Broad Impact:** AI is rapidly reshaping how we live and work across various sectors, such as healthcare and education, while researchers strive to make systems more efficient and human-aligned.
Create a tweet-length summary (280 chars):
AI is reshaping the world with LLMs that reason and converse naturally. Despite challenges in accuracy and ethics, researchers are pushing for efficient, aligned tech. From healthcare to education, this rapid evolution is transforming how we live and work. 🌍🤖 #AI
Question Answering
print("\n" + "="*80)
print("Question Answering")
print("="*80)
context = """The Eiffel Tower is a wrought-iron lattice tower located on the Champ de Mars
in Paris, France. It was constructed from 1887 to 1889 as the centerpiece of the 1889
World's Fair. The tower is 330 meters (1,083 feet) tall, about the same height as an
81-story building. It was the tallest man-made structure in the world until the Chrysler
Building was completed in New York in 1930."""
questions = [
"How tall is the Eiffel Tower?",
"What material is it made of?",
"When did it stop being the tallest structure?"
]
print(f"Context: {context}\n")
for q in questions:
prompt = f"Context: {context}\n\nQuestion: {q}\nAnswer (concise):"
response = client.models.generate_content(
model=MODEL,
contents=prompt
)
print(f"Q: {q}")
print(f"A: {response.text.strip()}\n")
================================================================================
Question Answering
================================================================================
Context: The Eiffel Tower is a wrought-iron lattice tower located on the Champ de Mars
in Paris, France. It was constructed from 1887 to 1889 as the centerpiece of the 1889
World's Fair. The tower is 330 meters (1,083 feet) tall, about the same height as an
81-story building. It was the tallest man-made structure in the world until the Chrysler
Building was completed in New York in 1930.
Q: How tall is the Eiffel Tower?
A: 330 meters (1,083 feet)
Q: What material is it made of?
A: Wrought-iron
Q: When did it stop being the tallest structure?
A: 1930
Multi-Language Translation
print("\n" + "="*80)
print("Multi-Language Translation")
print("="*80)
text = "Artificial intelligence is changing the world."
languages = ["Spanish", "Hindi"]
print(f"Original (English): {text}\n")
for lang in languages:
prompt = f"Translate to {lang}: {text}"
response = client.models.generate_content(
model=MODEL,
contents=prompt
)
print(f"{lang}: {response.text.strip()}")
================================================================================
Multi-Language Translation
================================================================================
Original (English): Artificial intelligence is changing the world.
Spanish: **La inteligencia artificial está cambiando el mundo.**
Hindi: The translation in Hindi is:
**कृत्रिम बुद्धिमत्ता दुनिया को बदल रही है।**
**Pronunciation:** *Kritrim buddhimatta duniya ko badal rahi hai.*
**Breakdown:**
* Artificial intelligence = कृत्रिम बुद्धिमत्ता (Kritrim buddhimatta)
* World = दुनिया (Duniya)
* Is changing = बदल रही है (Badal rahi hai)
*Note: In casual conversation, people often use the English term "Artificial Intelligence" directly, written as **आर्टिफिशियल इंटेलिजेंस**.*Vision and Image Understanding
Gemini-3-Pro excels at understanding and analyzing images, from object detection to complex visual reasoning.
Object Detection with Bounding Boxes
print("\n" + "="*80)
print("Object Detection with Bounding Boxes")
print("="*80)
import supervision as sv
import numpy as np
from PIL import Image
import requests
from io import BytesIO
# Load a cat image from Unsplash
cat_image_url = "https://images.unsplash.com/photo-1574158622682-e40e69881006?w=800"
print(f"Loading cat image from Unsplash...")
response = requests.get(cat_image_url)
image = Image.open(BytesIO(response.content))
print(f"Image loaded: {image.size[0]}x{image.size[1]} pixels")
# Display original image
plt.figure(figsize=(5, 4))
plt.imshow(image)
plt.title('Original Cat Image')
plt.axis('off')
plt.tight_layout()
plt.show()
================================================================================
Object Detection with Bounding Boxes
================================================================================
Loading cat image from Unsplash...
Image loaded: 800x800 pixels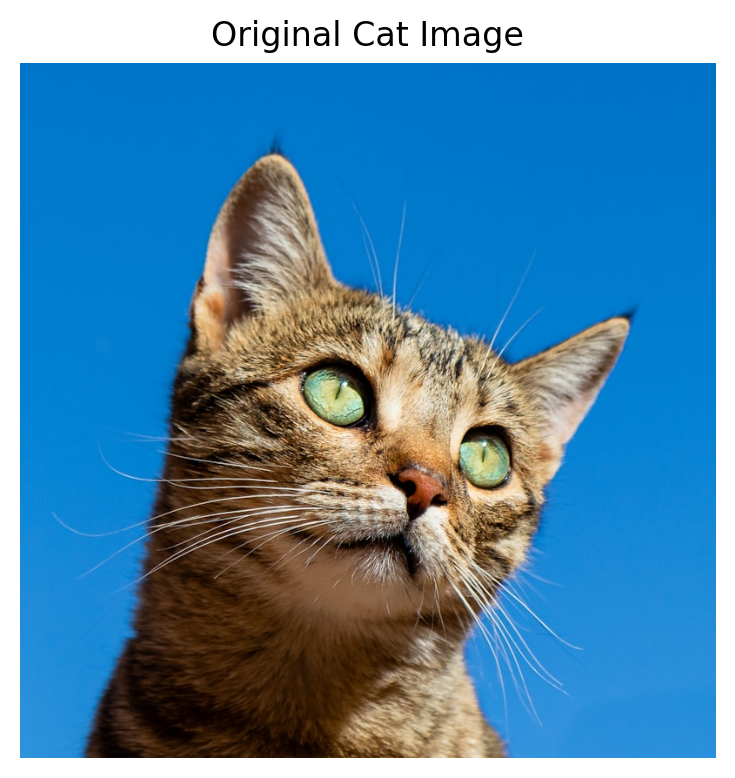
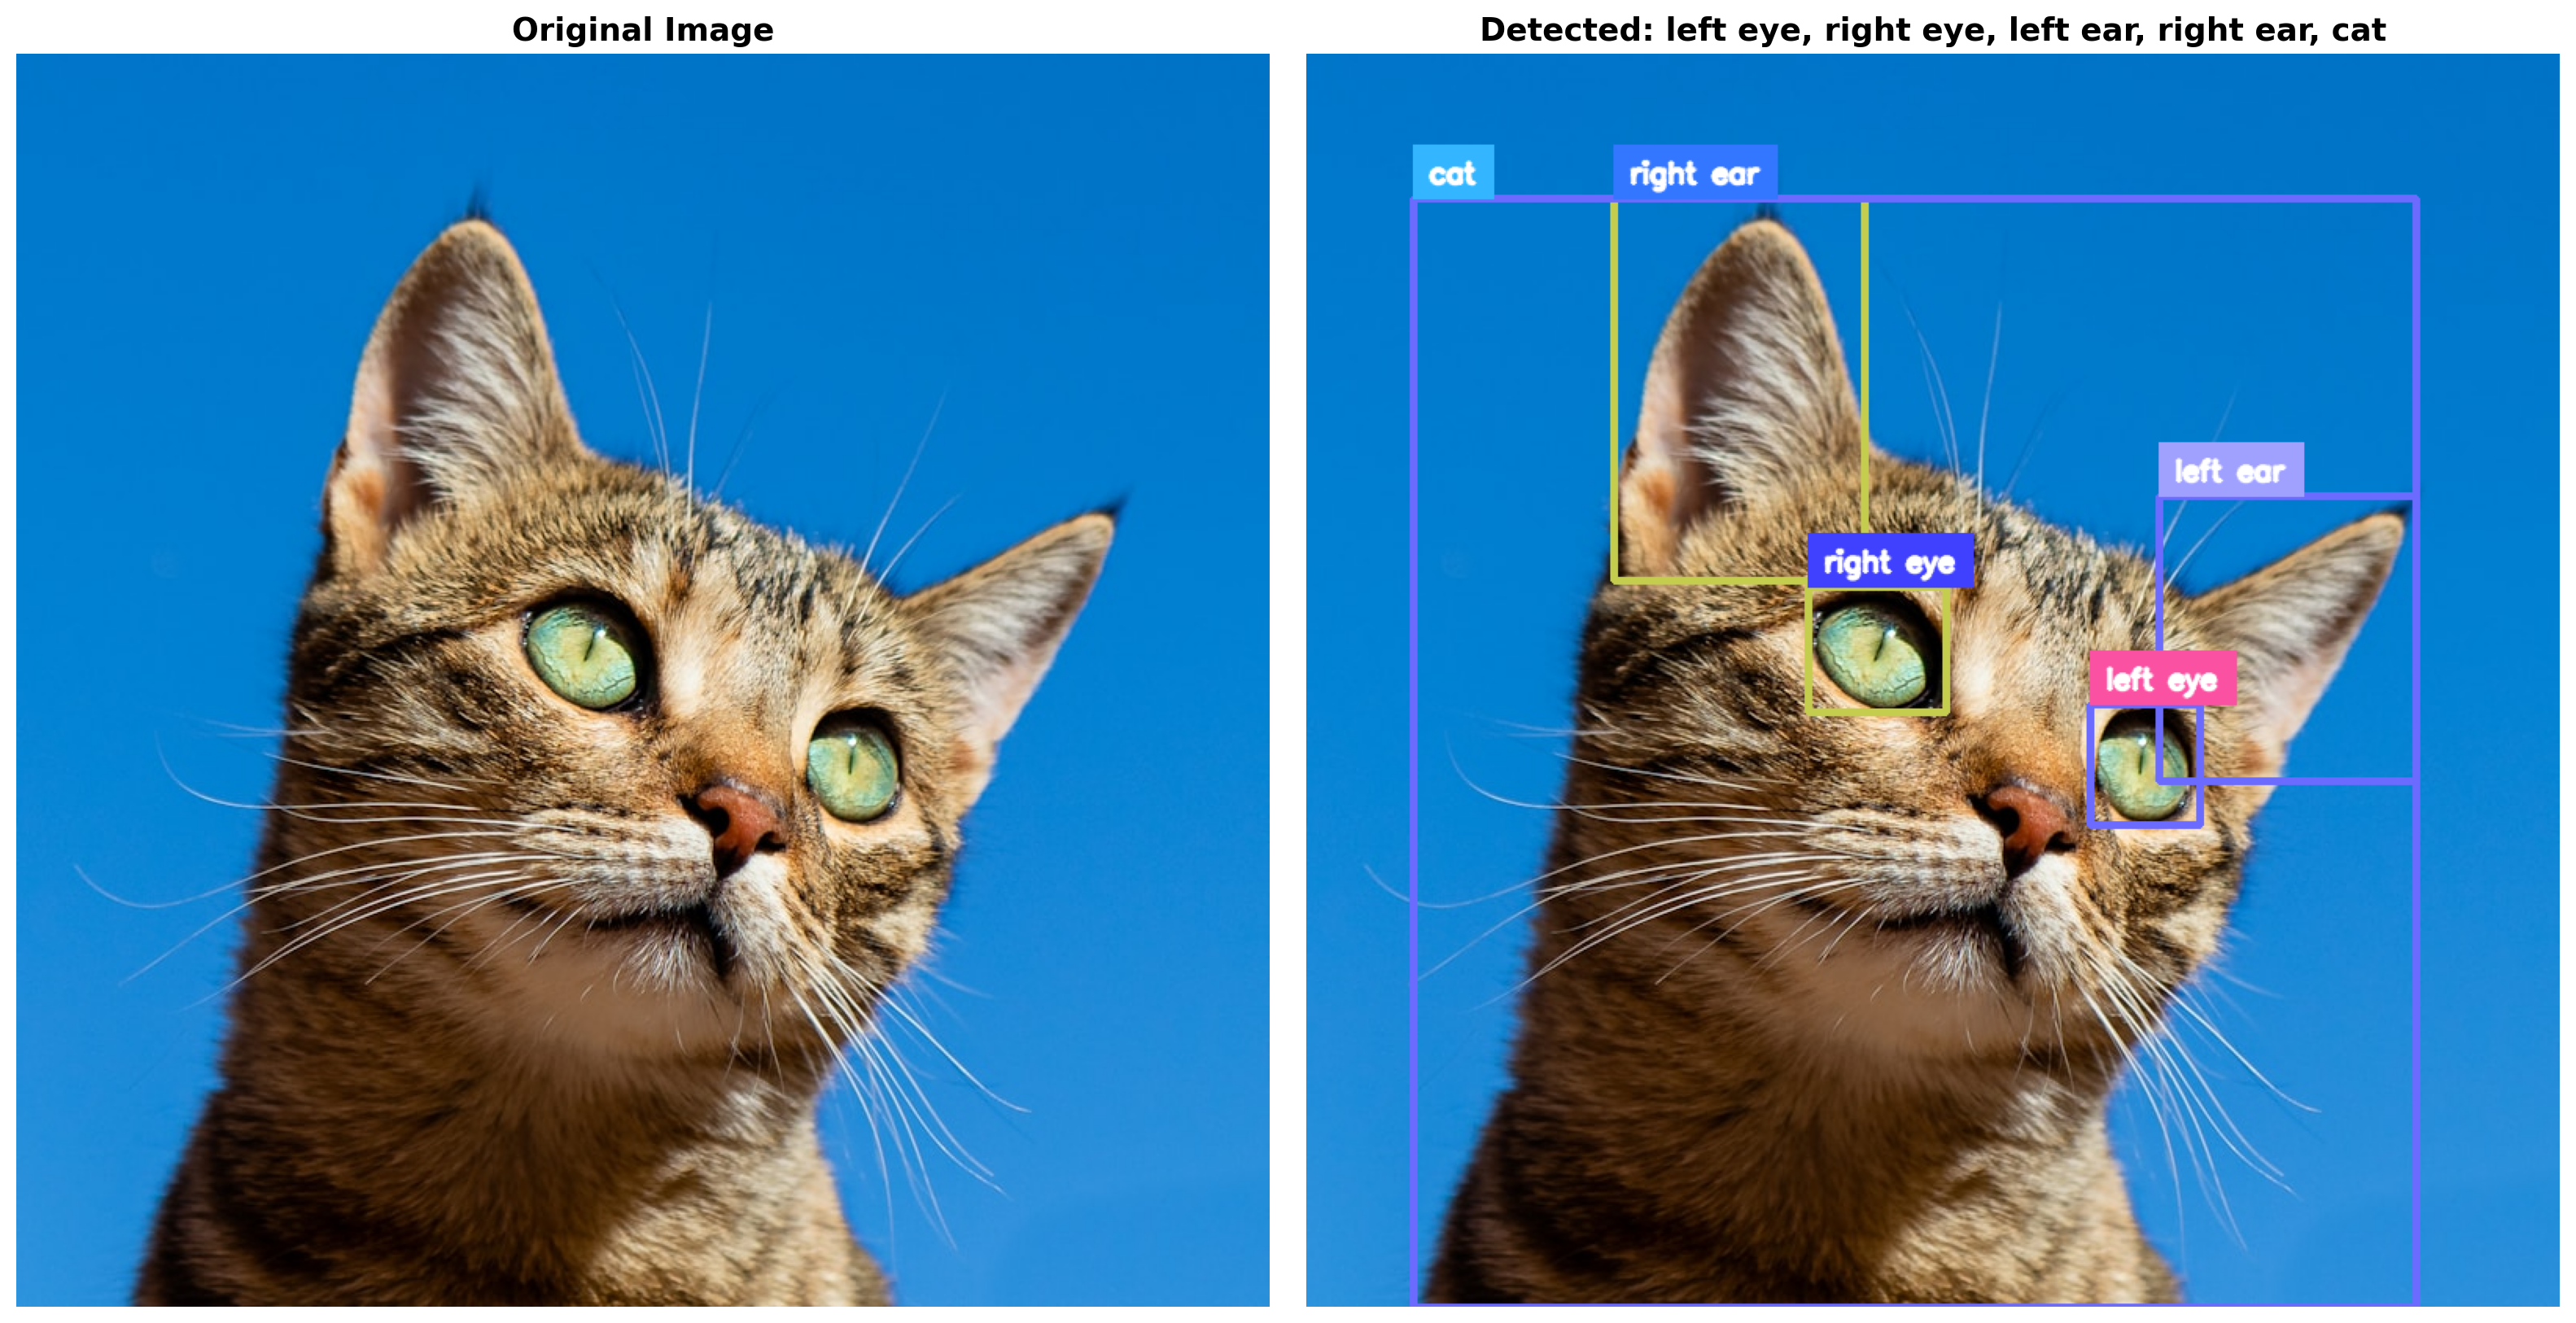
# Prompt Gemini to detect cat features
detection_prompt = """Detect the following objects in this image and return their bounding boxes:
1. The cat's left eye
2. The cat's right eye
3. The cat's left ear
4. The cat's right ear
5. The entire cat body
Return a JSON array where each object has:
- "label": object name (e.g., "left eye", "right eye", "left ear", "right ear", "cat")
- "box_2d": bounding box as [y_min, x_min, y_max, x_max] in range [0, 1000]
Format: [{"label": "left eye", "box_2d": [y0, x0, y1, x1]}, ...]
Return ONLY the JSON array, no other text."""
print("Asking Gemini to detect cat features (eyes, ears, body)...")
print()
response = client.models.generate_content(
model=MODEL,
contents=[detection_prompt, image]
)
print("Gemini Response:")
print(response.text)
print()Asking Gemini to detect cat features (eyes, ears, body)...
Gemini Response:
```json
[
{"box_2d": [519, 625, 615, 713], "label": "left eye"},
{"box_2d": [426, 400, 526, 510], "label": "right eye"},
{"box_2d": [353, 680, 580, 885], "label": "left ear"},
{"box_2d": [116, 245, 420, 445], "label": "right ear"},
{"box_2d": [116, 85, 1000, 885], "label": "cat"}
]
```
# Parse the JSON response
import json
import re
response_text = response.text.strip()
# Remove markdown code blocks if present
if response_text.startswith('```'):
lines = response_text.split('\n')
response_text = '\n'.join(lines[1:-1])
if response_text.startswith('json'):
response_text = response_text[4:].strip()
try:
detections_data = json.loads(response_text)
print(f"Detected {len(detections_data)} objects:")
for i, det in enumerate(detections_data, 1):
print(f" {i}. {det['label']}: box at {det['box_2d']}")
print()
# Convert Gemini's bounding boxes to supervision format
# Gemini: [y0, x0, y1, x1] in 0-1000 range
# Supervision: [x0, y0, x1, y1] in pixel coordinates
img_array = np.array(image)
height, width = img_array.shape[:2]
xyxy_boxes = []
labels = []
for det in detections_data:
y0, x0, y1, x1 = det['box_2d']
# Convert from 1000-scale to pixel coordinates
x0_px = int(x0 * width / 1000)
y0_px = int(y0 * height / 1000)
x1_px = int(x1 * width / 1000)
y1_px = int(y1 * height / 1000)
xyxy_boxes.append([x0_px, y0_px, x1_px, y1_px])
labels.append(det['label'])
# Create supervision Detections object
detections = sv.Detections(
xyxy=np.array(xyxy_boxes),
class_id=np.arange(len(labels))
)
# Annotate with colored bounding boxes and labels
box_annotator = sv.BoxAnnotator(
thickness=3,
color=sv.ColorPalette.from_hex(['#FF6B6B', '#4ECDC4'])
)
label_annotator = sv.LabelAnnotator(
text_scale=0.6,
text_thickness=2,
text_color=sv.Color.WHITE
)
annotated_image = box_annotator.annotate(
scene=img_array.copy(),
detections=detections
)
annotated_image = label_annotator.annotate(
scene=annotated_image,
detections=detections,
labels=labels
)
# Display side-by-side comparison
fig, (ax1, ax2) = plt.subplots(1, 2, figsize=(16, 8))
ax1.imshow(image)
ax1.set_title('Original Image', fontsize=14, fontweight='bold')
ax1.axis('off')
ax2.imshow(annotated_image)
ax2.set_title(f'Detected: {", ".join(labels)}', fontsize=14, fontweight='bold')
ax2.axis('off')
plt.tight_layout()
plt.show()
print("Detection complete!")
print()
print("Technical details:")
print(f"- Gemini returns boxes in [y0, x0, y1, x1] format")
print(f"- Coordinates scaled 0-1000 (normalized)")
print(f"- Converted to pixel coords: {width}x{height}")
print(f"- Visualized using supervision library")
except json.JSONDecodeError as e:
print(f"Error parsing JSON: {e}")
print(f"Response text: {response_text}")Detected 5 objects:
1. left eye: box at [519, 625, 615, 713]
2. right eye: box at [426, 400, 526, 510]
3. left ear: box at [353, 680, 580, 885]
4. right ear: box at [116, 245, 420, 445]
5. cat: box at [116, 85, 1000, 885]
Detection complete!
Technical details:
- Gemini returns boxes in [y0, x0, y1, x1] format
- Coordinates scaled 0-1000 (normalized)
- Converted to pixel coords: 800x800
- Visualized using supervision libraryImage Segmentation
Now let’s segment the cat to get a pixel-perfect mask
# Request SVG segmentation from Gemini (faster than PNG mask)
segmentation_prompt = """Segment the cat in this image and return it as an SVG polygon.
Return a JSON object with:
- "label": "cat"
- "polygon": array of [x, y] coordinates in range [0, 1000] forming the outline
Example: {"label": "cat", "polygon": [[x1,y1], [x2,y2], [x3,y3], ...]}
Return ONLY the JSON object."""
print("Asking Gemini for SVG polygon segmentation...")
seg_response = client.models.generate_content(
model=MODEL,
contents=[segmentation_prompt, image]
)
print("Response:")
print(seg_response.text[:300] + "..." if len(seg_response.text) > 300 else seg_response.text)Asking Gemini for SVG polygon segmentation...
Response:
```json
{
"label": "cat",
"polygon": [
[91, 1000],
[105, 925],
[128, 850],
[150, 775],
[175, 690],
[195, 600],
[210, 530],
[225, 450],
[240, 370],
[250, 300],
[270, 220],
[300, 160],
[330, 130],
[365, 117],
[385, 170],
[405, 230],
...# Parse SVG polygon and visualize
from matplotlib.patches import Polygon as MPLPolygon
response_text = seg_response.text.strip()
if response_text.startswith('```'):
lines = response_text.split('\n')
response_text = '\n'.join(lines[1:-1])
if response_text.startswith('json'):
response_text = response_text[4:].strip()
seg_data = json.loads(response_text)
print(f"Label: {seg_data['label']}")
print(f"Polygon points: {len(seg_data['polygon'])}")
# Convert polygon from 1000-scale to pixel coordinates
img_array = np.array(image)
height, width = img_array.shape[:2]
polygon_coords = []
for x, y in seg_data['polygon']:
px = int(x * width / 1000)
py = int(y * height / 1000)
polygon_coords.append([px, py])
polygon_coords = np.array(polygon_coords)
# Create mask from polygon
from matplotlib.path import Path
x, y = np.meshgrid(np.arange(width), np.arange(height))
points = np.c_[x.ravel(), y.ravel()]
path = Path(polygon_coords)
mask = path.contains_points(points).reshape(height, width)
# Create overlay
overlay = img_array.copy().astype(float)
color = np.array([255, 100, 100])
for c in range(3):
overlay[:,:,c] = np.where(mask, overlay[:,:,c]*0.5 + color[c]*0.5, overlay[:,:,c])
overlay = overlay.astype(np.uint8)
# Visualize
fig, axes = plt.subplots(1, 3, figsize=(18, 6))
axes[0].imshow(image)
axes[0].set_title('Original', fontsize=14, fontweight='bold')
axes[0].axis('off')
axes[1].imshow(image)
poly_patch = MPLPolygon(polygon_coords, fill=False, edgecolor='red', linewidth=2)
axes[1].add_patch(poly_patch)
axes[1].set_title('SVG Polygon Outline', fontsize=14, fontweight='bold')
axes[1].axis('off')
axes[2].imshow(overlay)
axes[2].set_title('Segmentation Overlay', fontsize=14, fontweight='bold')
axes[2].axis('off')
plt.tight_layout()
plt.savefig("cat_segmentation_demo.png", dpi=300, bbox_inches="tight")
plt.show()
print(f"\nCoverage: {100*mask.sum()/mask.size:.1f}%")Label: cat
Polygon points: 35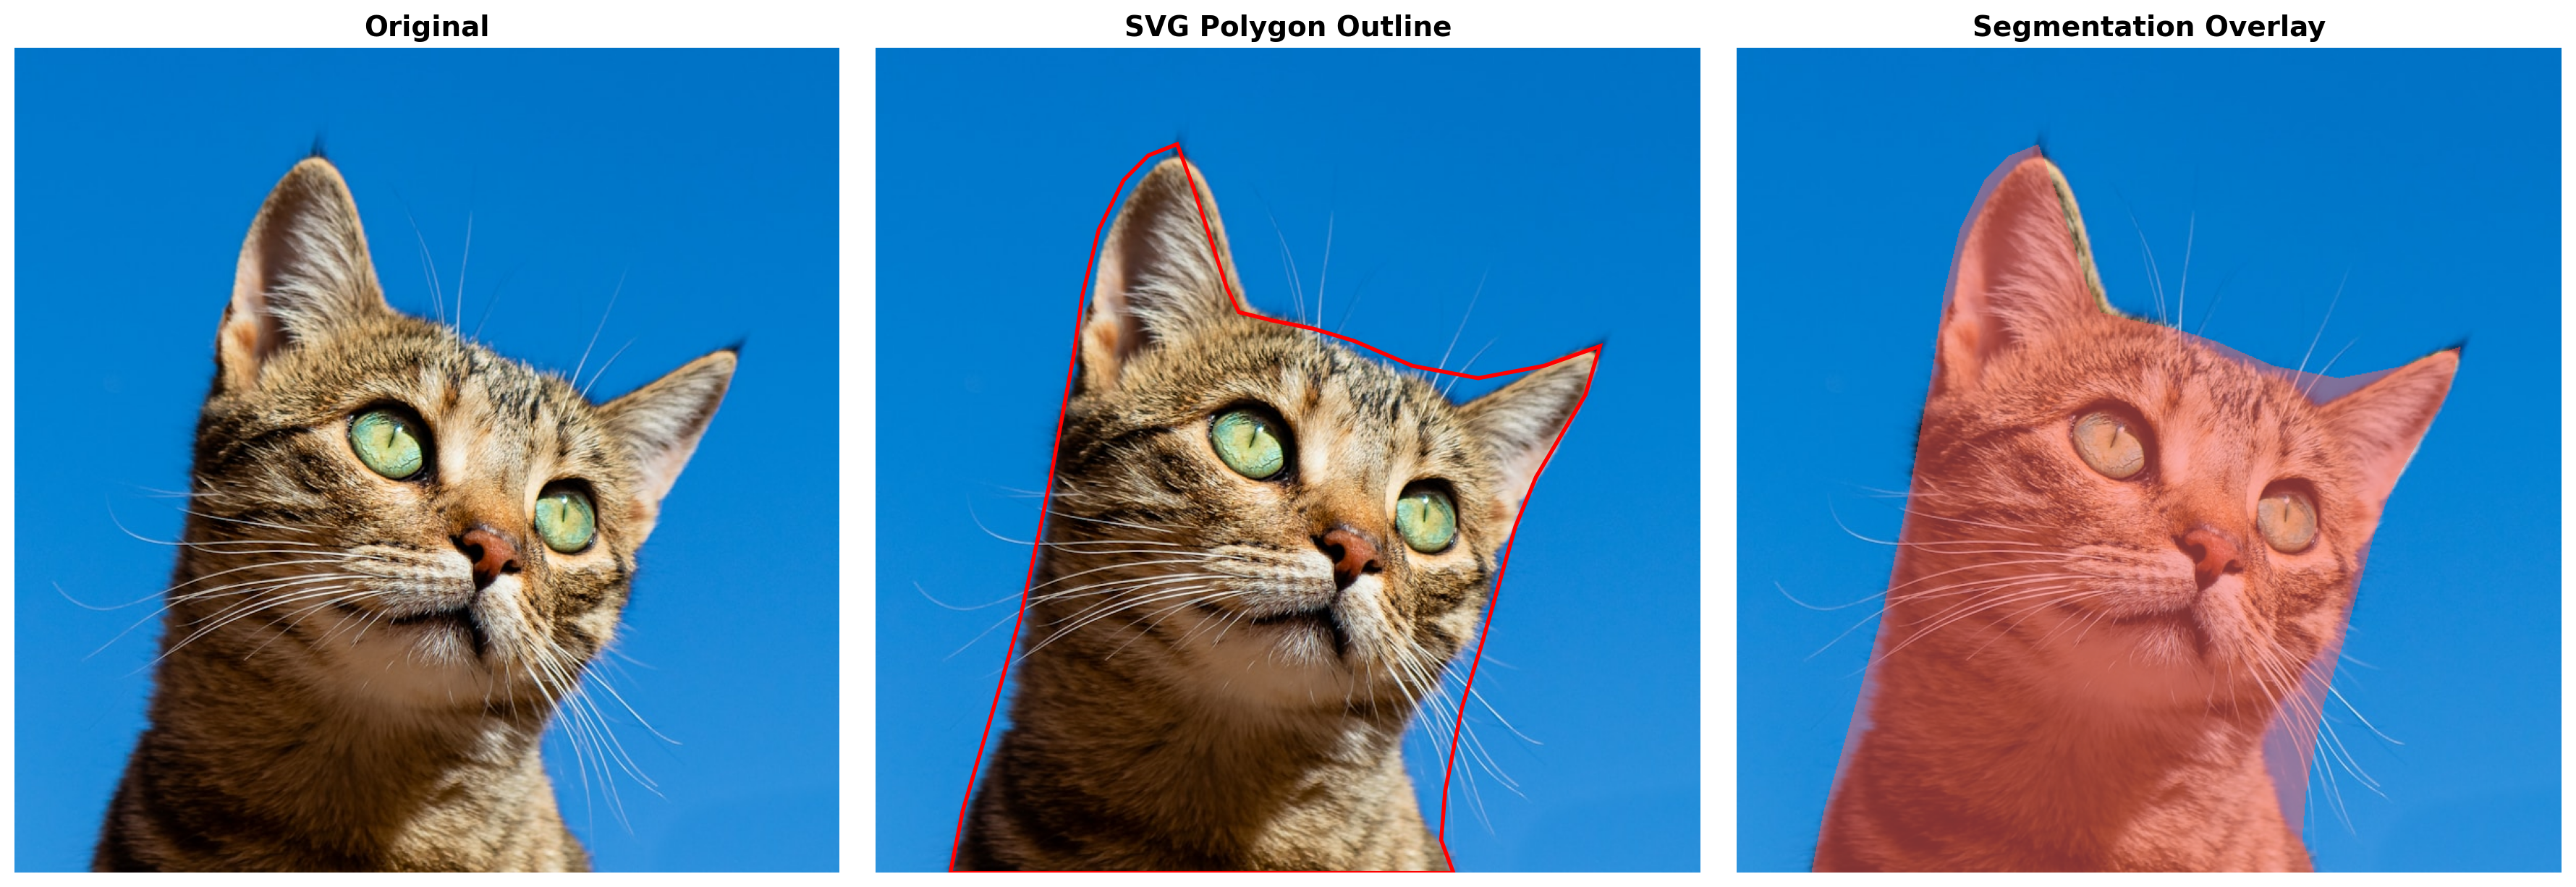
Coverage: 40.4%Mathematical Problem Solving from Images
Read a handwritten/printed math problem and solve it step-by-step
# Load math problem image
math_image = Image.open('least-squares.jpg')
print("Math problem image loaded")
print(f"Size: {math_image.size}")
plt.figure(figsize=(12, 8))
plt.imshow(math_image)
plt.title('Original Math Problem', fontsize=14, fontweight='bold')
plt.axis('off')
plt.tight_layout()
plt.show()Math problem image loaded
Size: (1992, 1250)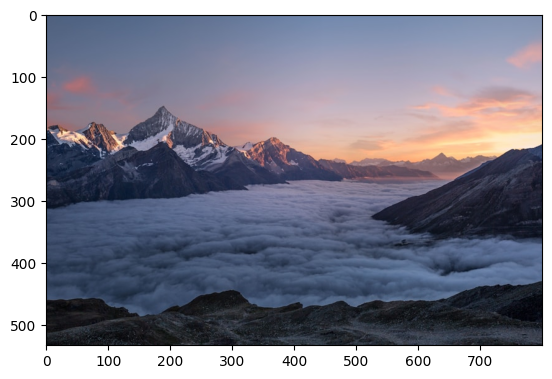
# Ask Gemini to solve the math problem
math_prompt = """Look at this mathematical problem and solve it step by step.
Please:
1. First, identify what mathematical concepts/formulas are shown
2. Solve the problem completely, showing all steps
3. Explain each step clearly
4. Provide the final answer
Format your response as if you were writing it by hand on paper, with clear steps."""
print("Asking Gemini to solve the math problem...")
print()
math_response = client.models.generate_content(
model=MODEL,
contents=[math_prompt, math_image]
)
print("Gemini's Solution:")
print("="*80)
print(math_response.text)
print("="*80)Asking Gemini to solve the math problem...
Gemini's Solution:
================================================================================
Based on the image provided, here is the step-by-step solution to the mathematical problem.
### 1. Identify Mathematical Concepts
This image depicts the derivation of the **Normal Equation** used in **Linear Regression** (a fundamental algorithm in Machine Learning and Statistics).
* **$J(\theta)$**: This represents the **Cost Function** (specifically the Sum of Squared Errors or Residual Sum of Squares). It measures the difference between the predicted values and the actual values.
* **$\epsilon_i$**: The error (residual) for a single data point.
* **$(y - X\theta)$**: The vector notation for the errors, where $y$ is the target vector, $X$ is the feature matrix (Design Matrix), and $\theta$ is the parameter vector (weights).
* **$\theta^*$**: This represents the **optimal parameters** that minimize the cost function.
---
### 2. Step-by-Step Solution
The goal is to find the value of $\theta$ (denoted as $\theta^*$) that minimizes the cost function $J(\theta)$. To do this, we need to expand the matrix expression, take the derivative (gradient) with respect to $\theta$, set it to zero, and solve for $\theta$.
**Step 1: Expand the Cost Function expression**
We start with the matrix form given in the image:
$$J(\theta) = (y - X\theta)^T (y - X\theta)$$
Using the property of transpose $(A - B)^T = A^T - B^T$, we distribute the transpose:
$$J(\theta) = (y^T - (X\theta)^T) (y - X\theta)$$
$$J(\theta) = (y^T - \theta^T X^T) (y - X\theta)$$
Now, perform the matrix multiplication (FOIL method: First, Outer, Inner, Last):
$$J(\theta) = y^T y - y^T X\theta - \theta^T X^T y + \theta^T X^T X \theta$$
**Step 2: Simplify the scalar terms**
The terms $y^T X\theta$ and $\theta^T X^T y$ result in a scalar value (a single number, $1 \times 1$ matrix). Since the transpose of a scalar is itself ($a = a^T$), and $(\theta^T X^T y)^T = y^T X \theta$, these two terms are actually identical.
We can combine them:
$$J(\theta) = y^T y - 2\theta^T X^T y + \theta^T X^T X \theta$$
**Step 3: Calculate the Gradient (Derivative)**
To find the minimum, we take the derivative of $J(\theta)$ with respect to $\theta$ (denoted as $\nabla_{\theta} J(\theta)$).
Rules of Matrix Calculus used here:
1. $\frac{\partial}{\partial \theta} (constant) = 0$
2. $\frac{\partial}{\partial \theta} (-2\theta^T A) = -2A$ (where $A = X^T y$)
3. $\frac{\partial}{\partial \theta} (\theta^T A \theta) = 2A\theta$ (where $A = X^T X$, which is a symmetric matrix)
Applying these rules:
$$\nabla_{\theta} J(\theta) = 0 - 2X^T y + 2X^T X \theta$$
**Step 4: Set Gradient to Zero and Solve**
To find the optimal $\theta^*$, set the gradient equal to zero:
$$-2X^T y + 2X^T X \theta = 0$$
Divide by 2:
$$-X^T y + X^T X \theta = 0$$
Move the negative term to the other side:
$$X^T X \theta = X^T y$$
To isolate $\theta$, multiply both sides by the inverse of $(X^T X)$, assuming it is invertible:
$$\theta = (X^T X)^{-1} X^T y$$
---
### 3. Final Answer
The optimal value $\theta^*$ that completes the derivation in the image is:
$$ \theta^* = (X^T X)^{-1} X^T y $$
================================================================================# Generate handwritten-style solution image
from IPython.display import Markdown, display
# First show the markdown solution
print("Solution:")
print("="*80)
display(Markdown(math_response.text))
print("="*80)
# Now generate a handwritten-style image of the solution
IMAGE_MODEL = "models/gemini-3-pro-image-preview"
image_prompt = f"""Create a handwritten-style mathematical solution on paper.
The solution should show:
{math_response.text[:500]}
Style:
- Handwritten on white/cream paper
- Clear mathematical notation
- Step-by-step layout
- Professional but handwritten feel
- Include diagrams if helpful
- Blue/black ink style
Make it look like a student's neat homework solution."""
print("\nGenerating handwritten-style solution image...")
result = client.models.generate_content(
model=IMAGE_MODEL,
contents=image_prompt
)
# Display generated image
if result.candidates[0].content.parts:
for part in result.candidates[0].content.parts:
if hasattr(part, 'inline_data'):
import base64
from io import BytesIO
image_data = base64.b64decode(part.inline_data.data)
generated_img = Image.open(BytesIO(image_data))
plt.figure(figsize=(14, 10))
plt.imshow(generated_img)
plt.title('AI-Generated Handwritten Solution', fontsize=14, fontweight='bold')
plt.axis('off')
plt.tight_layout()
plt.show()
print("\nGenerated handwritten-style solution image!")
else:
print("No image generated")Solution:
================================================================================Based on the image provided, here is the step-by-step solution to the mathematical problem.
1. Identify Mathematical Concepts
This image depicts the derivation of the Normal Equation used in Linear Regression (a fundamental algorithm in Machine Learning and Statistics).
- \(J(\theta)\): This represents the Cost Function (specifically the Sum of Squared Errors or Residual Sum of Squares). It measures the difference between the predicted values and the actual values.
- \(\epsilon_i\): The error (residual) for a single data point.
- \((y - X\theta)\): The vector notation for the errors, where \(y\) is the target vector, \(X\) is the feature matrix (Design Matrix), and \(\theta\) is the parameter vector (weights).
- \(\theta^*\): This represents the optimal parameters that minimize the cost function.
2. Step-by-Step Solution
The goal is to find the value of \(\theta\) (denoted as \(\theta^*\)) that minimizes the cost function \(J(\theta)\). To do this, we need to expand the matrix expression, take the derivative (gradient) with respect to \(\theta\), set it to zero, and solve for \(\theta\).
Step 1: Expand the Cost Function expression We start with the matrix form given in the image: \[J(\theta) = (y - X\theta)^T (y - X\theta)\]
Using the property of transpose \((A - B)^T = A^T - B^T\), we distribute the transpose: \[J(\theta) = (y^T - (X\theta)^T) (y - X\theta)\] \[J(\theta) = (y^T - \theta^T X^T) (y - X\theta)\]
Now, perform the matrix multiplication (FOIL method: First, Outer, Inner, Last): \[J(\theta) = y^T y - y^T X\theta - \theta^T X^T y + \theta^T X^T X \theta\]
Step 2: Simplify the scalar terms The terms \(y^T X\theta\) and \(\theta^T X^T y\) result in a scalar value (a single number, \(1 \times 1\) matrix). Since the transpose of a scalar is itself (\(a = a^T\)), and \((\theta^T X^T y)^T = y^T X \theta\), these two terms are actually identical.
We can combine them: \[J(\theta) = y^T y - 2\theta^T X^T y + \theta^T X^T X \theta\]
Step 3: Calculate the Gradient (Derivative) To find the minimum, we take the derivative of \(J(\theta)\) with respect to \(\theta\) (denoted as \(\nabla_{\theta} J(\theta)\)).
Rules of Matrix Calculus used here: 1. \(\frac{\partial}{\partial \theta} (constant) = 0\) 2. \(\frac{\partial}{\partial \theta} (-2\theta^T A) = -2A\) (where \(A = X^T y\)) 3. \(\frac{\partial}{\partial \theta} (\theta^T A \theta) = 2A\theta\) (where \(A = X^T X\), which is a symmetric matrix)
Applying these rules: \[\nabla_{\theta} J(\theta) = 0 - 2X^T y + 2X^T X \theta\]
Step 4: Set Gradient to Zero and Solve To find the optimal \(\theta^*\), set the gradient equal to zero: \[-2X^T y + 2X^T X \theta = 0\]
Divide by 2: \[-X^T y + X^T X \theta = 0\]
Move the negative term to the other side: \[X^T X \theta = X^T y\]
To isolate \(\theta\), multiply both sides by the inverse of \((X^T X)\), assuming it is invertible: \[\theta = (X^T X)^{-1} X^T y\]
3. Final Answer
The optimal value \(\theta^*\) that completes the derivation in the image is:
\[ \theta^* = (X^T X)^{-1} X^T y \]
================================================================================
Generating handwritten-style solution image...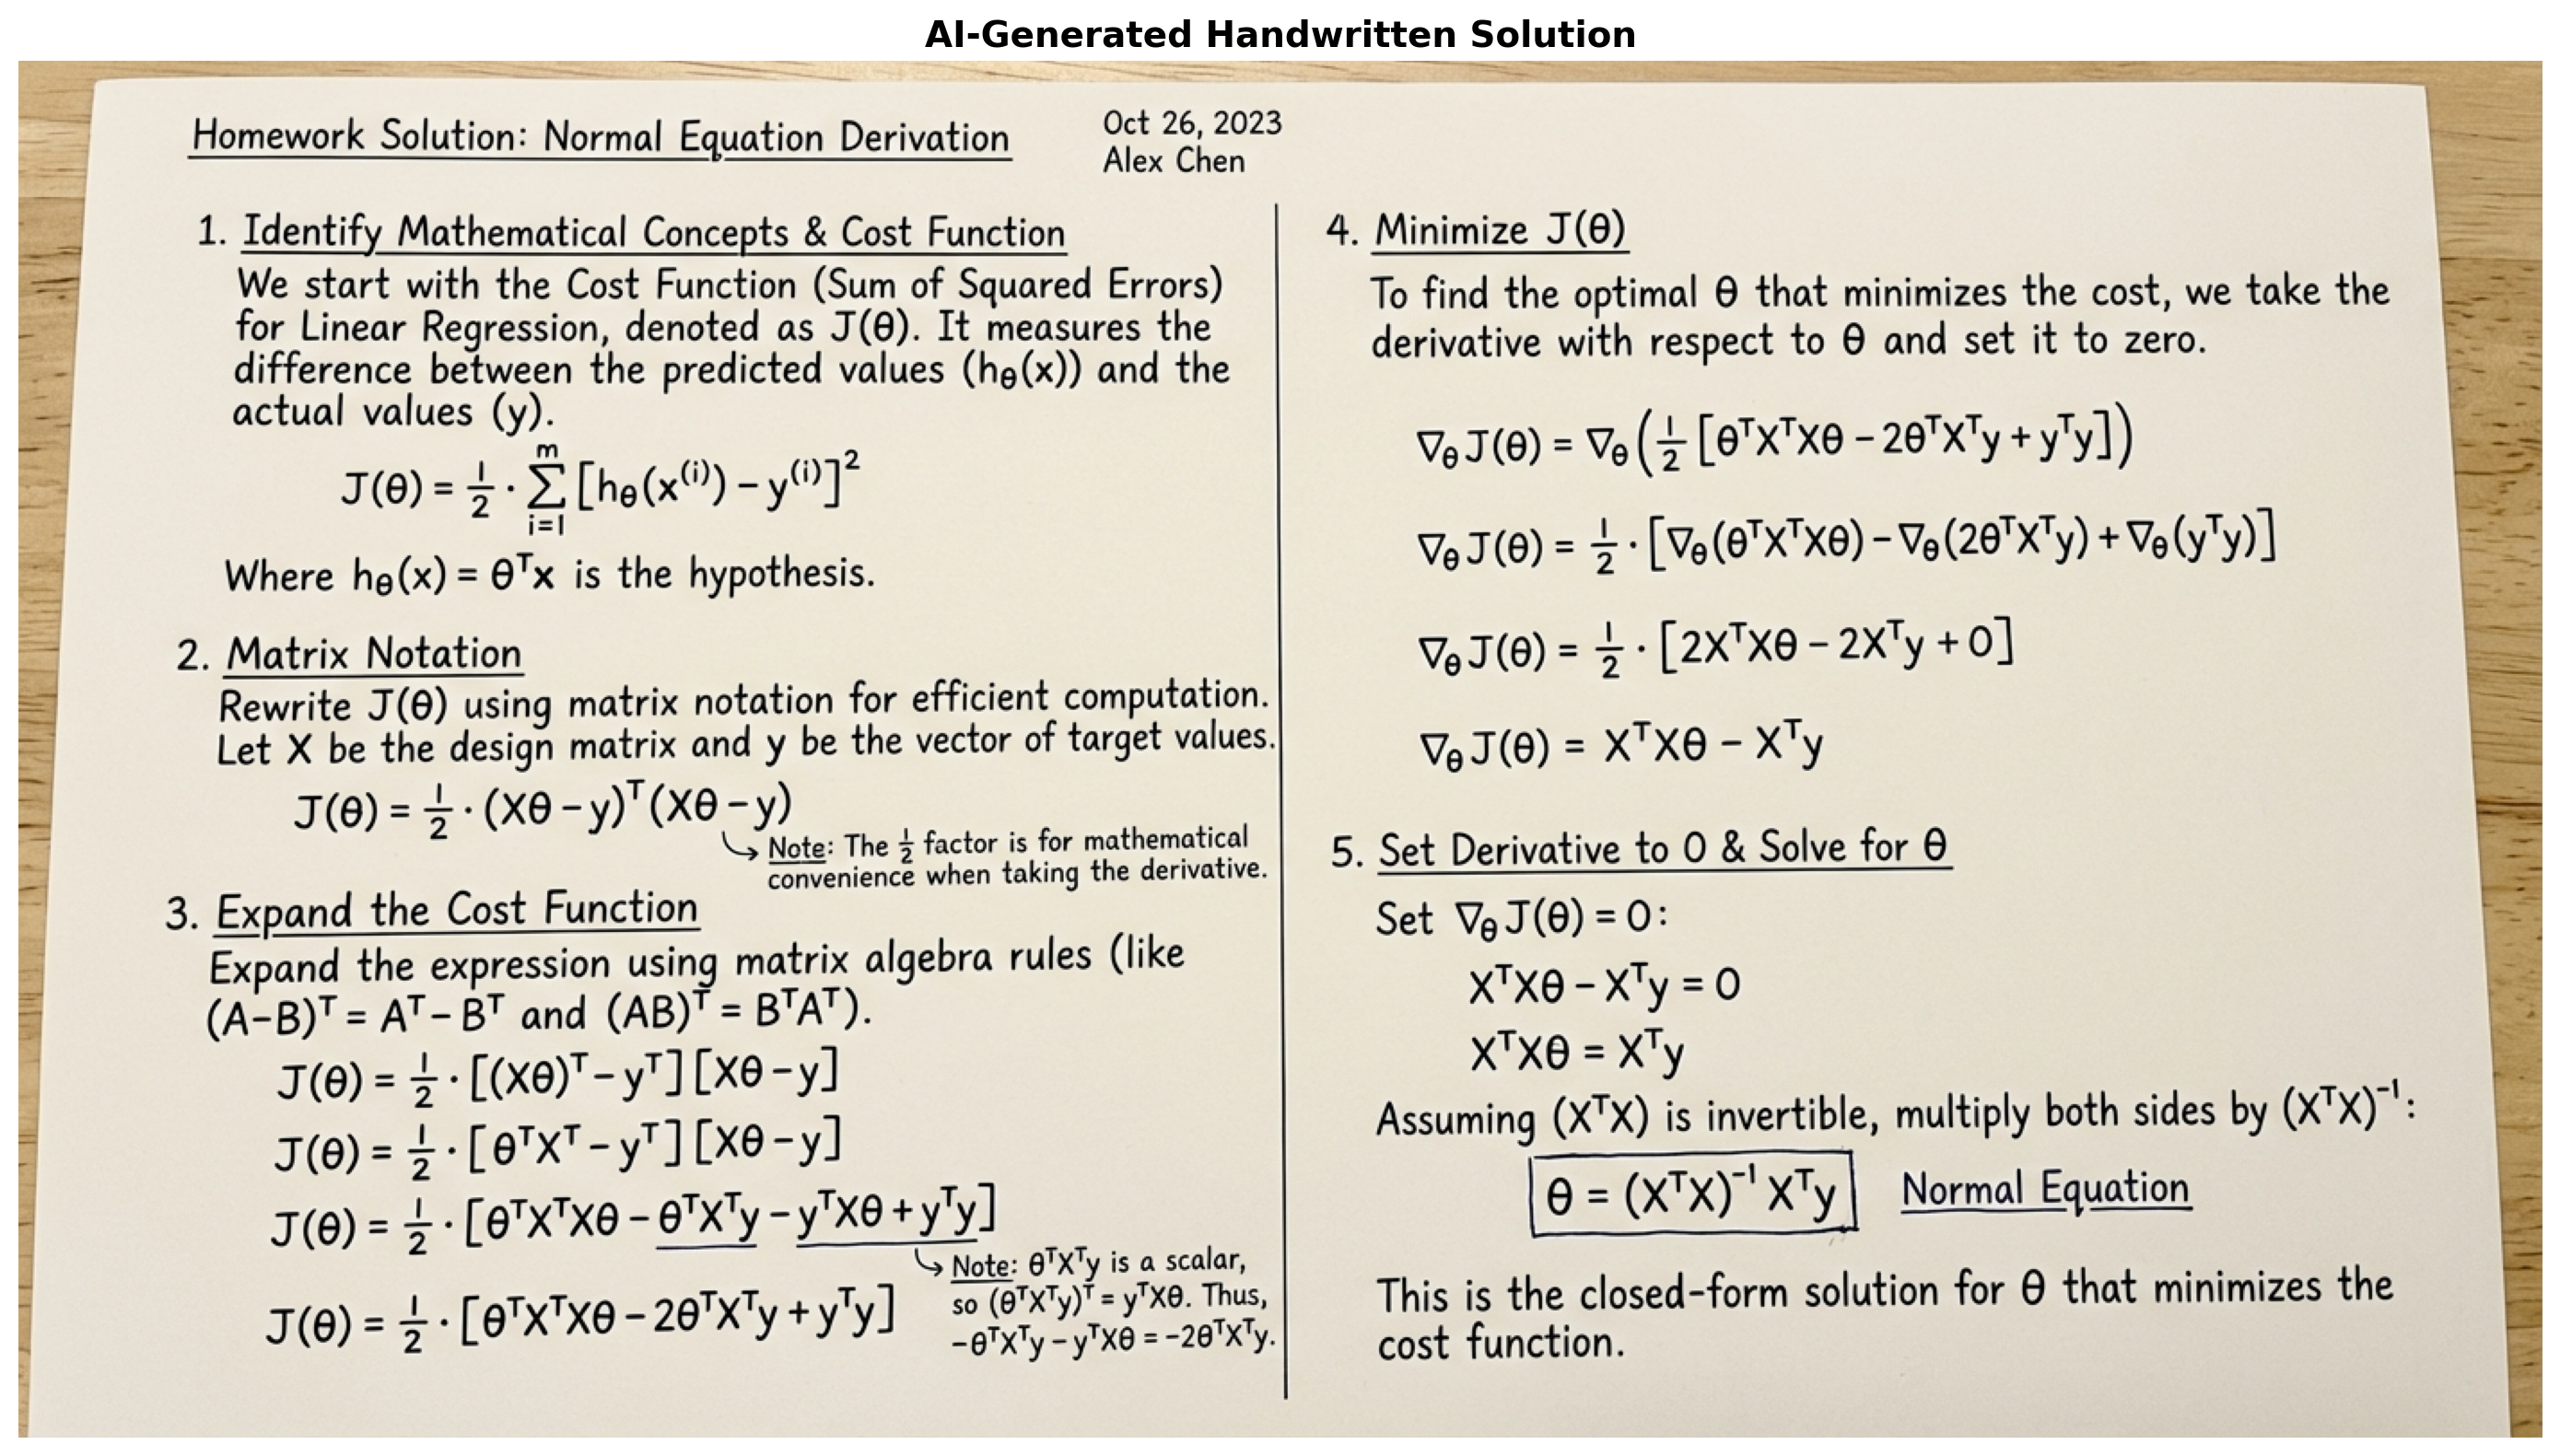
Generated handwritten-style solution image!Visual Question Answering (VQA)
print("\n" + "="*80)
print("Visual Question Answering")
print("="*80)
# Use sample images from URLs
try:
image_url = "https://images.unsplash.com/photo-1506905925346-21bda4d32df4?w=800"
image = load_image_from_url(image_url)
# Show image
plt.imshow(image)
questions = [
"What is the dominant color in this image?",
"Describe the scenery",
"What time of day does it appear to be?",
"What mood does this image convey?"
]
for q in questions:
response = client.models.generate_content(
model=MODEL,
contents=[q, image]
)
print(f"Q: {q}")
print(f"A: {response.text.strip()}\n")
except Exception as e:
print(f"Note: Image loading requires internet. Error: {str(e)[:100]}")
================================================================================
Visual Question Answering
================================================================================
Q: What is the dominant color in this image?
A: Based on the image, the dominant color is **blue**, specifically ranging from **cool blue-greys** to **slate** and soft **lavender**.
Here's a breakdown of the color palette:
* **The Sea of Clouds:** The vast majority of the image is filled with a layer of clouds that are shadowed and appear in muted shades of blue and grey.
* **The Shadows:** The dark, rocky mountains and the foreground are primarily dark grey and deep blue, blending with the cool atmospheric tones.
* **Contrasting Accents:** While blue dominates the surface area, the image features striking accents of **pastel pink, peach, and soft orange** in the sky and reflecting off the mountain peaks, indicating a sunrise or sunset. These warm colors provide a beautiful contrast to the overwhelming cool blue tones.
Q: Describe the scenery
A: Based on the image, here is a description of the scenery:
**Overview**
This is a majestic high-altitude alpine landscape captured during twilight—either sunrise or sunset. The scene is dominated by a dramatic "sea of clouds" (cloud inversion) from which rugged mountain peaks emerge like islands.
**The Sky**
The sky displays a soft, gradient palette characteristic of the "golden hour" or civil twilight. It transitions from a cool, slate blue at the top into warm hues of pastel pink, salmon, and soft orange near the horizon. There are wispy, scattered clouds high in the sky that are catching the warm glow of the sun.
**The Mountains**
A jagged mountain range pierces through the cloud layer.
* **Left Side:** The most prominent feature is a sharp, pyramidal peak on the left (reminiscent of the Swiss Alps). It has steep, dark rocky faces dusted with patches of white snow and glaciers.
* **Right Side:** On the right, a massive, dark mountain slope angles downward, framing the composition and leading the eye toward the center.
**The Sea of Clouds**
Below the peaks, a thick, textured blanket of clouds fills the valley floor completely. These clouds are rolling and billowy, resembling ocean waves. They are colored in cool shades of gray and blue, indicating they are in the shadow of the mountains, contrasting beautifully with the warm light in the sky above.
**The Foreground**
In the immediate foreground, dark, rough terrain and rocky outcrops serve as the viewing point, grounding the image and emphasizing the vast scale of the scenery beyond.
Q: What time of day does it appear to be?
A: Based on the lighting and colors in the image, it appears to be either **sunrise or sunset**.
Here are the visual clues:
* **Colors:** The sky displays soft gradients of pink, orange, and purple, which are characteristic of the "golden hour" when the sun is low on the horizon.
* **Alpenglow:** The tips of the mountain peaks are illuminated with a warm, reddish-pink light, a phenomenon known as alpenglow that happens just before sunrise or just after sunset.
* **Shadows:** The valleys and the sea of clouds below are still in deep, cool shadow, indicating the sun hasn't risen high enough to light them yet (or has already dipped below the horizon).
While it is difficult to say for certain without knowing the geographic orientation, the thick "sea of clouds" settling in the valley is a phenomenon very commonly seen in the **early morning** at sunrise.
Q: What mood does this image convey?
A: This image conveys a strong mood of **serenity, majesty, and awe**. Here is a breakdown of the specific feelings invoked by the visual elements:
* **Tranquility and Peace:** The vast "sea of clouds" blanketing the valley creates a sense of profound stillness and silence. It feels as though the noisy, chaotic world below has been muffled, leaving only a quiet, meditative space above.
* **Grandeur and The Sublime:** The towering, jagged mountain peaks rising out of the mist emphasize the sheer scale and power of nature. This contrast between the solid, dark rock and the soft, ephemeral clouds creates a feeling of being small in the presence of something magnificent.
* **Ethereal and Dreamy:** The lighting—likely from sunrise or sunset—casts soft pastel hues of pink, lavender, and orange across the sky and the tips of the mountains. This creates a magical, almost otherworldly atmosphere.
* **Solitude and Contemplation:** The high vantage point places the viewer above everything else, suggesting a moment of solitary reflection. It feels isolated, but in a comforting, peaceful way rather than a lonely one.
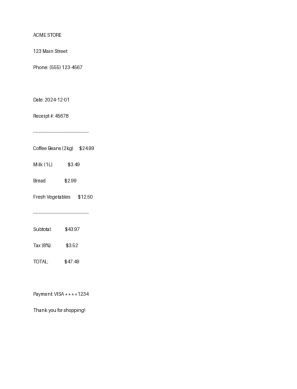
Chart and Graph Analysis
print("\n" + "="*80)
print("Chart Analysis")
print("="*80)
# Create a complex chart
fig, (ax1, ax2) = plt.subplots(1, 2, figsize=(14, 6))
# Bar chart
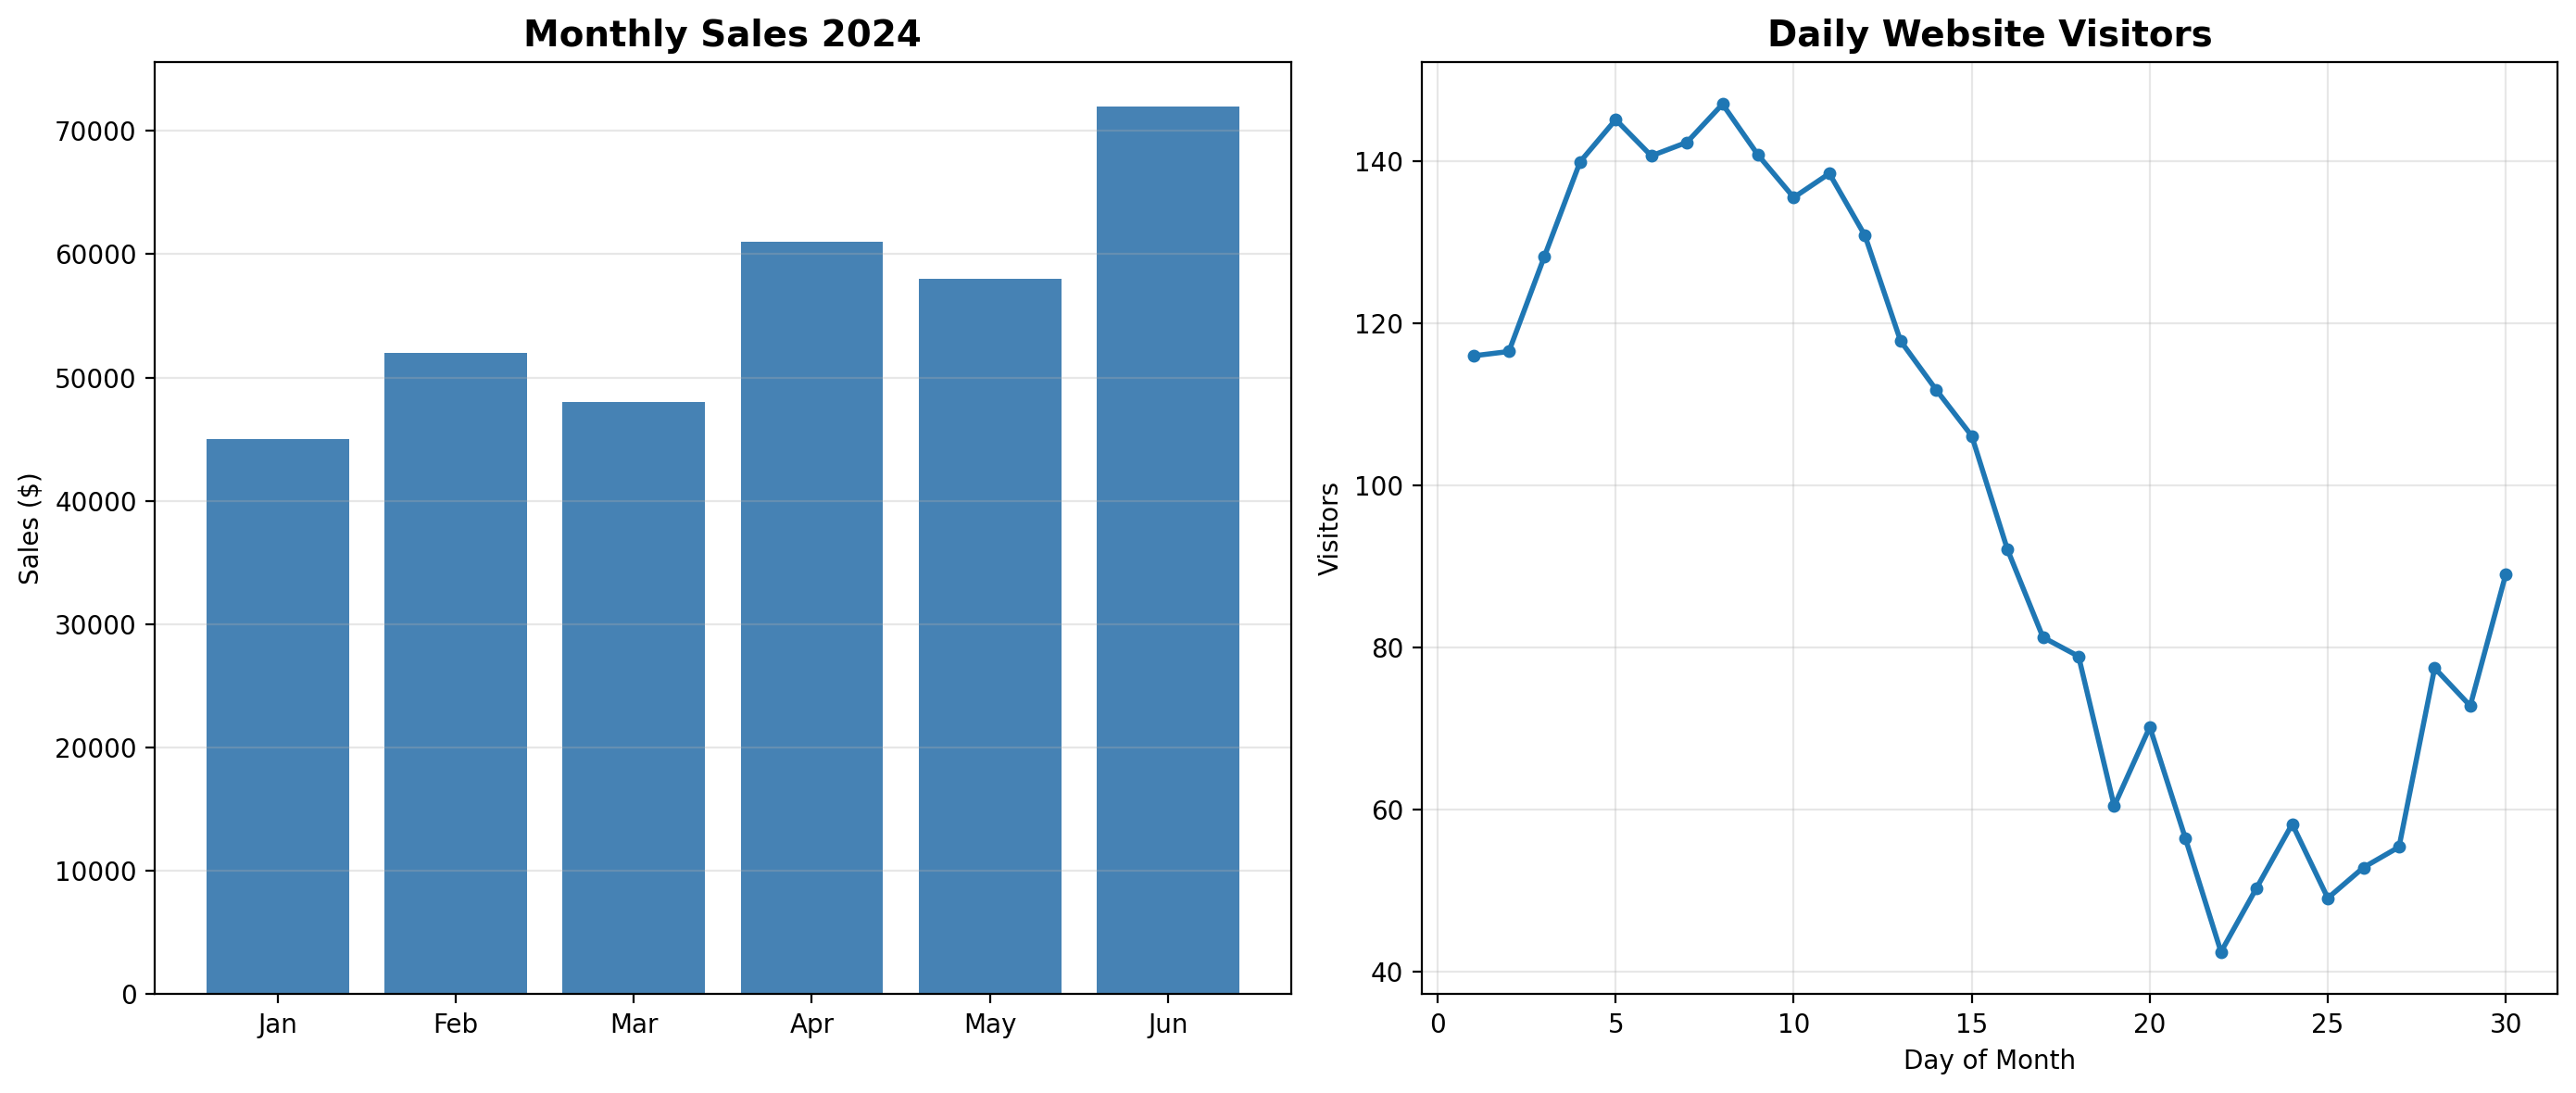
months = ['Jan', 'Feb', 'Mar', 'Apr', 'May', 'Jun']
sales = [45000, 52000, 48000, 61000, 58000, 72000]
ax1.bar(months, sales, color='steelblue')
ax1.set_title('Monthly Sales 2024', fontsize=14, fontweight='bold')
ax1.set_ylabel('Sales ($)')
ax1.grid(axis='y', alpha=0.3)
# Line chart
days = list(range(1, 31))
visitors = [100 + 50*np.sin(x/5) + np.random.randint(-10, 10) for x in days]
ax2.plot(days, visitors, marker='o', linewidth=2, markersize=4)
ax2.set_title('Daily Website Visitors', fontsize=14, fontweight='bold')
ax2.set_xlabel('Day of Month')
ax2.set_ylabel('Visitors')
ax2.grid(alpha=0.3)
plt.tight_layout()
plt.savefig('/tmp/charts.png', dpi=150)
================================================================================
Chart Analysis
================================================================================
plt.close()
chart_image = Image.open('/tmp/charts.png')
prompt = """Analyze these charts:
1. What trends do you see in the sales data?
2. Which month had the highest sales?
3. What pattern is visible in the website visitors chart?
4. Any notable insights?"""
response = client.models.generate_content(
model=MODEL,
contents=[prompt, chart_image])
print(response.text)Based on the provided charts, here is an analysis of the data:
**1. What trends do you see in the sales data?**
The "Monthly Sales 2024" chart shows an overall **positive, upward trend** over the first half of the year. While the growth isn't perfectly linear—there are slight dips in March and May—the general trajectory is growth. The sales figures start at roughly \$45,000 in January and end significantly higher in June.
**2. Which month had the highest sales?**
**June** had the highest sales performance. The bar for June is the tallest, clearly exceeding the \$70,000 mark (appearing to be around \$72,000).
**3. What pattern is visible in the website visitors chart?**
The "Daily Website Visitors" chart displays a distinct **"peak and decline" pattern**.
* **Early Peak:** Traffic rises sharply at the beginning of the month, peaking between Day 5 and Day 10 (reaching nearly 150 visitors).
* **Mid-Month Slump:** From roughly Day 11 to Day 22, there is a steady and significant decline in visitors, hitting a low of roughly 40-45 visitors.
* **Late Recovery:** Starting around Day 23, the traffic begins to climb again towards the end of the month.
**4. Any notable insights?**
* **Sales vs. Consistency:** While sales are growing generally, the "saw-tooth" pattern (up-down-up-down) suggests some inconsistency. Every record-breaking month (April, June) is preceded by a month where growth stalled or dipped slightly.
* **Traffic Volatility:** The website traffic is highly volatile. The drop from the peak (~148 visitors) to the trough (~42 visitors) represents a roughly **70% decrease in traffic**. This suggests that whatever marketing or engagement strategy is used at the start of the month loses its effectiveness by the third week.
* **Potential Opportunity:** The business seems to struggle with "mid-month" engagement. Finding a way to sustain the website traffic seen in the first week could potentially smooth out the sales dips seen in months like March and May.Document OCR and Understanding
Gemini-3-Pro’s document understanding goes beyond simple OCR. It can extract, interpret, and reason about text in complex layouts including receipts, forms, and multi-column documents. This is powered by Gemini-3-Pro’s exceptional performance on document understanding benchmarks.
print("\n" + "="*80)
print("Document OCR + Understanding")
print("="*80)
# Create a sample receipt
img = Image.new('RGB', (600, 800), color='white')
draw = ImageDraw.Draw(img)
receipt_lines = [
"ACME STORE",
"123 Main Street",
"Phone: (555) 123-4567",
"",
"Date: 2024-12-01",
"Receipt #: 45678",
"-" * 40,
"Coffee Beans (2kg) $24.99",
"Milk (1L) $3.49",
"Bread $2.99",
"Fresh Vegetables $12.50",
"-" * 40,
"Subtotal: $43.97",
"Tax (8%): $3.52",
"TOTAL: $47.49",
"",
"Payment: VISA ****1234",
"Thank you for shopping!"
]
y = 50
for line in receipt_lines:
draw.text((50, y), line, fill='black')
y += 35
img.save('/tmp/receipt.png')
receipt_img = Image.open('/tmp/receipt.png')
plt.imshow(receipt_img)
plt.axis('off')
================================================================================
Document OCR + Understanding
================================================================================
prompt = """Extract information from this receipt:
1. Store name and address
2. Date and receipt number
3. List of items purchased with prices
4. Total amount
5. Payment method
Format as structured JSON."""
response = client.models.generate_content(
model=MODEL,
contents=[prompt, receipt_img])
print(response.text)```json
{
"store_info": {
"name": "ACME STORE",
"address": "123 Main Street"
},
"receipt_info": {
"date": "2024-12-01",
"receipt_number": "45678"
},
"items": [
{
"description": "Coffee Beans (2kg)",
"price": 24.99
},
{
"description": "Milk (1L)",
"price": 3.49
},
{
"description": "Bread",
"price": 2.99
},
{
"description": "Fresh Vegetables",
"price": 12.50
}
],
"totals": {
"subtotal": 43.97,
"tax": 3.52,
"total_amount": 47.49
},
"payment_method": "VISA **** 1234"
}
```Video Understanding
video_path = '14801276_2160_3840_30fps.mp4'
from IPython.display import Video
# Display video with constrained width (max 600px)
Video(video_path, embed=True, height=400)