# Plot training comparison
fig, axes = plt.subplots(2, 2, figsize=(15, 10))
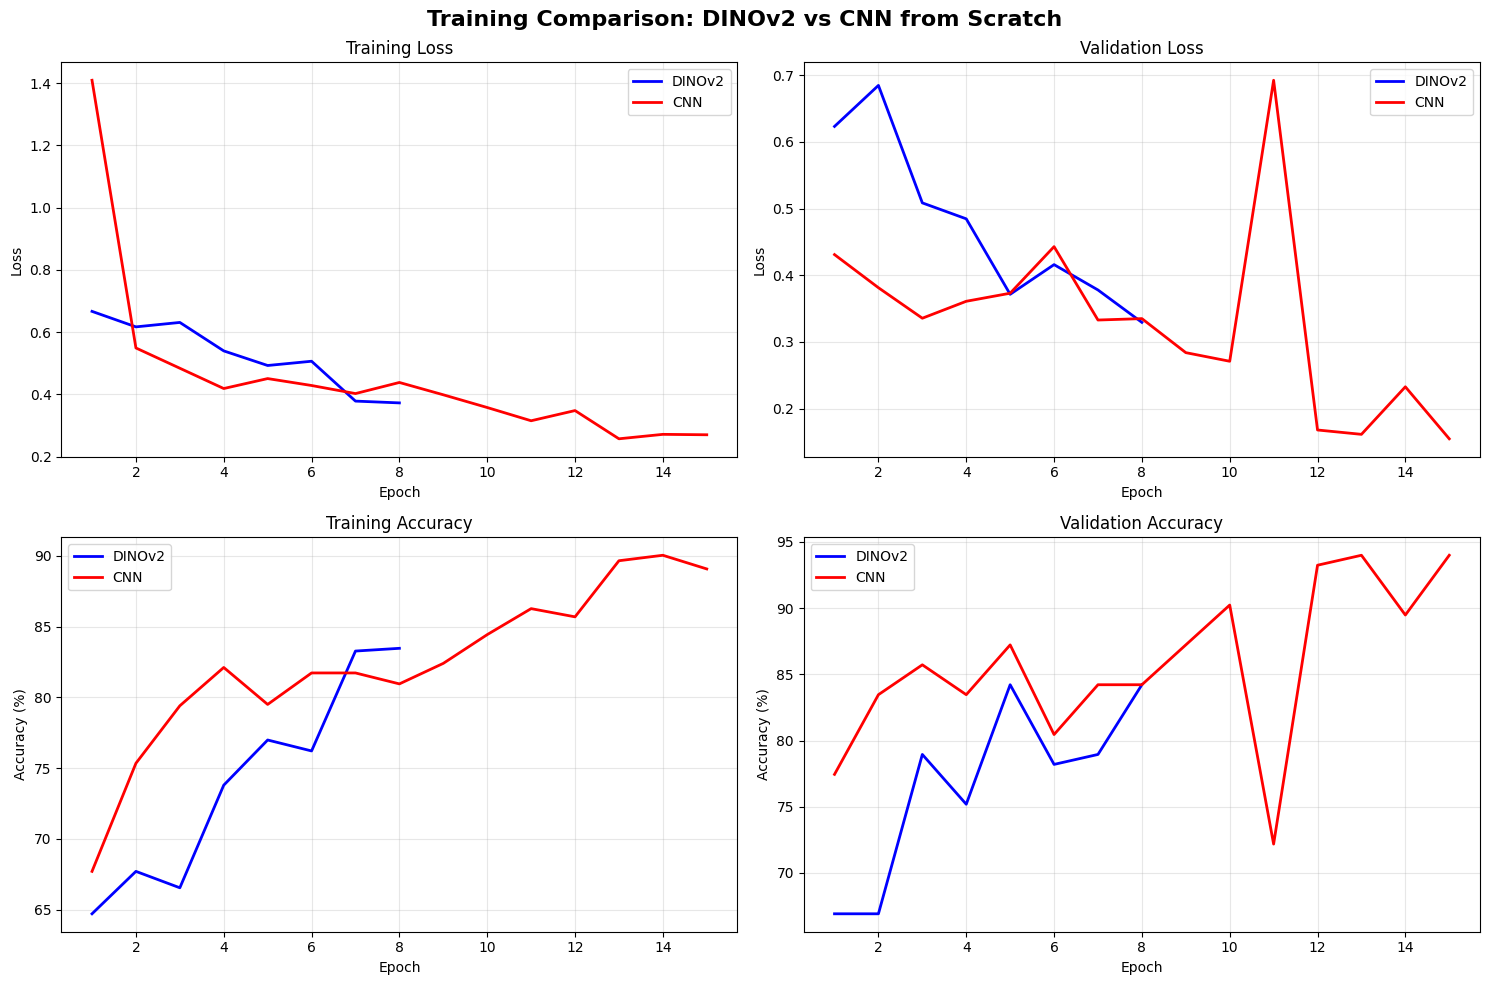
fig.suptitle('Training Comparison: DINOv2 vs CNN from Scratch', fontsize=16, fontweight='bold')
# Training Loss
axes[0, 0].plot(dinov2_history['epochs'], dinov2_history['train_loss'], 'b-', label='DINOv2', linewidth=2)
axes[0, 0].plot(cnn_history['epochs'], cnn_history['train_loss'], 'r-', label='CNN', linewidth=2)
axes[0, 0].set_title('Training Loss')
axes[0, 0].set_xlabel('Epoch')
axes[0, 0].set_ylabel('Loss')
axes[0, 0].legend()
axes[0, 0].grid(True, alpha=0.3)
# Validation Loss
axes[0, 1].plot(dinov2_history['epochs'], dinov2_history['val_loss'], 'b-', label='DINOv2', linewidth=2)
axes[0, 1].plot(cnn_history['epochs'], cnn_history['val_loss'], 'r-', label='CNN', linewidth=2)
axes[0, 1].set_title('Validation Loss')
axes[0, 1].set_xlabel('Epoch')
axes[0, 1].set_ylabel('Loss')
axes[0, 1].legend()
axes[0, 1].grid(True, alpha=0.3)
# Training Accuracy
axes[1, 0].plot(dinov2_history['epochs'], dinov2_history['train_acc'], 'b-', label='DINOv2', linewidth=2)
axes[1, 0].plot(cnn_history['epochs'], cnn_history['train_acc'], 'r-', label='CNN', linewidth=2)
axes[1, 0].set_title('Training Accuracy')
axes[1, 0].set_xlabel('Epoch')
axes[1, 0].set_ylabel('Accuracy (%)')
axes[1, 0].legend()
axes[1, 0].grid(True, alpha=0.3)
# Validation Accuracy
axes[1, 1].plot(dinov2_history['epochs'], dinov2_history['val_acc'], 'b-', label='DINOv2', linewidth=2)
axes[1, 1].plot(cnn_history['epochs'], cnn_history['val_acc'], 'r-', label='CNN', linewidth=2)
axes[1, 1].set_title('Validation Accuracy')
axes[1, 1].set_xlabel('Epoch')
axes[1, 1].set_ylabel('Accuracy (%)')
axes[1, 1].legend()
axes[1, 1].grid(True, alpha=0.3)
plt.tight_layout()
plt.show()