import numpy as np
import matplotlib.pyplot as plt
%matplotlib inline
%config InlineBackend.figure_format = 'retina'Maximum likelihood estimation
data = np.array([1, 1, 1, 1, 1, 1, 1, 1, 0, 0])n_h = np.sum(data)
n_t = len(data) - n_h
n_h, n_t(8, 2)def likelihood(theta):
return theta**n_h * (1-theta)**n_t
def log_likelihood(theta):
return n_h * np.log(theta) + n_t * np.log(1-theta)likelihood(0.1)8.100000000000005e-09likelihood(0.9)0.004304672099999999likelihood(0.8)0.0067108864fig, ax = plt.subplots(nrows=2, sharex=True)
x_lin = np.linspace(0.01, 0.99, 100)
y_lin = likelihood(x_lin)
y_lin_ll = log_likelihood(x_lin)
ax[0].plot(x_lin, y_lin)
ax[1].plot(x_lin, y_lin_ll)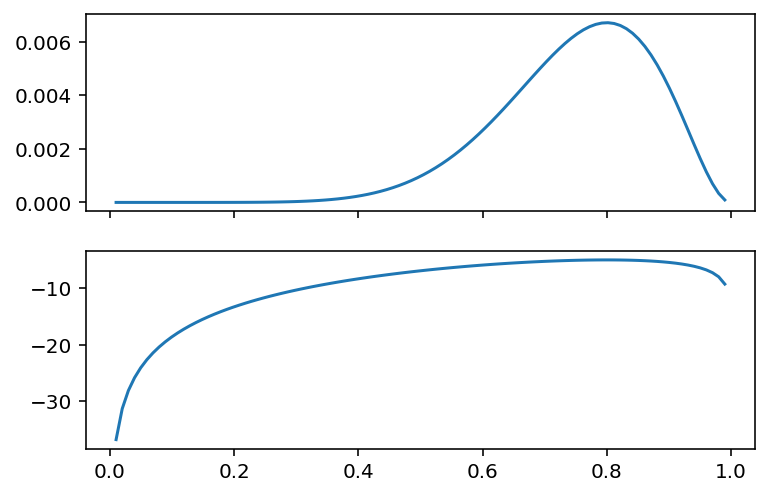
import torch

theta = 0.2
bn = torch.distributions.Bernoulli(probs= theta)

data = []
for i in range(100):
    data.append(bn.sample())
tensor(59.)