One question per Short, answered in under a minute with a small example you can check. The questions follow the order of the machine learning course I teach at IIT Gandhinagar, from what it means for a computer to learn up to neural networks.
91 Shorts so far, with more on the way.
91 Shorts
No matches
Try a broader word such as accuracy, tree, line or neuron.
Basics
What it means for a computer to learn, and how a problem becomes data.
-

How does a computer learn to sort good tomatoes from bad?
Arthur Samuel described machine learning in 1959 as giving computers the ability to learn without being explicitly programmed. A computer sees four tomatoes with known answers, good or bad, and has to fill in the answer for new ones. Tom Mitchell's version: a program learns if its score on a task gets better with experience.
-

Could you write rules that spot every handwritten 4?
A hand-written rule says a digit is a 4 if four boxes on the image have enough white pixels. On 982 real handwritten 4s it finds only 42. A small neural network that learns from 60,000 labelled digits finds 97.1% of them.
-

Same fruits, no labels. Can a computer still group them?
Example: 12 fruits plotted by redness and size, first with their labels (6 oranges, 6 apples) and then with no labels at all. With labels, a model learns a border and labels a new fruit; that is supervised learning. With no labels, fruits that sit close together still fall into 2 groups, which is unsupervised learning, though it cannot name them.
-

Is the sample number a useful feature for predicting a tomato's quality?
Four tomatoes are described by colour, size and texture, and each row has a sample number from 1 to 4. In this table samples 1 and 2 are good and 3 and 4 are bad, but number the same rows in another order and that pattern breaks while the tomatoes stay the same. Sample numbers are labels for the rows, so they are usually not a useful feature, though they can help with tracking, such as finding which batch a delayed truck carried.
-

Colour is red, green or blue. Code it as 1, 2, 3 for a linear model?
Coded as 1, 2, 3, the colours look like amounts: green sits halfway between red and blue, and blue counts 3 times red. In an example where red, green and blue shirts sell 7, 9 and 2 (hundred), a straight line on the codes predicts 8.5, 6 and 3.5, missing green by 3. One-hot encoding gives each colour its own 0/1 column, so each colour gets its own weight and the fit is exact.
-

Spam, cat or dog, house prices, tumors: which is a regression problem?
Tomato quality has two possible answers, good or bad, and a loan is yes or no: that is classification. Campus energy use is a number, like 30, 32 or 40 kWh, and a new answer can land anywhere on the scale: that is regression. Of spam, cat-dog-bird photos, house prices and tumors, only house prices ask for a number.
-

A decision tree gets 100% on its training data. Does that tell you its test score?
A decision tree is grown on 455 of the 569 tumors in the Wisconsin breast cancer data and gets all 455 right: 100%. On the 114 tumors it never saw, it gets 104 right: 91.2%. Only data kept out of training, a test set, gives an honest score.
Evaluation
Accuracy, precision, recall and error measures, and when each one misleads.
-

A test is 99% accurate. Is it a good test?
1,000 people are tested and only 10 are sick. A lazy test calls everyone healthy, so 990 of its 1,000 answers are right: 99% accuracy. Every one of its 10 wrong answers is a sick person it missed.
-

A model says 'good' but the tomato is bad. What is that mistake called?
A model that looks for good tomatoes is tested on 8 tomatoes and gets 5 right and 3 wrong. Twice it calls a bad tomato good, a false alarm (false positive); once it calls a good tomato bad, a miss (false negative). The confusion matrix puts all four counts in one grid: 3, 2, 1 and 2.
-

Test A is 99% accurate, Test B is 95.8%. Which would you use?
Of 1,000 people, 10 are sick. Test A is 99% accurate but calls everyone healthy, so it catches none of them. Test B is 95.8% accurate, catches 8 of the 10 and also flags 40 healthy people. Which is better depends on which mistake costs more; for cancer screening a missed sick person usually does, so check recall, the share of sick people caught.
-

A test flags 48 people as possibly sick. How many are really sick?
Of 1,000 people, 10 are sick. A test flags 48 people as possibly sick: it catches 8 of the sick ones and also flags 40 healthy people. So only 8 of its 48 alarms are real, about 1 in 6 (16.7%); that share is called precision.
-

2% of 10,000 defective, precision 0.60, recall 0.90. How many get flagged?
Of 10,000 products, 2% are defective: 200. A model with recall 0.90 catches 180 of them, and precision 0.60 means those 180 are 60% of everything it flags. So it flags 180 / 0.60 = 300 products, 120 of them false alarms.
-

Model 1: precision 0.70, recall 0.85. Model 2: the reverse. Which job needs Model 1?
Model 1 has precision 0.70 and recall 0.85, so it misses 15 of every 100 real cases but 30 of every 100 alarms are false. Model 2 is the other way round. At airport security a missed threat costs the most, so that job needs Model 1; spam filters and card fraud checks suffer more from false alarms.
-

A detector flags scores of 0.5 or more. Raise the bar to 0.7. What usually happens?
In this example a detector scores 10 satellite images, and 5 of them show a brick kiln. Flagging scores of 0.5 or more finds 4 kilns with 2 false alarms; raising the bar to 0.7 finds 3 kilns with 1 false alarm. Precision rises from 67% to 75% while recall falls from 80% to 60%.
-

A perfect model has an ROC AUC of 1. What does a coin-flipping model get?
A perfect model catches every sick person before it flags any healthy one, so the area under its ROC curve is 1. In this example a coin that says sick half the time flags, on average, half of the sick and half of the healthy people, and every coin lands on the diagonal. The area under the diagonal is half the square, so a coin's ROC AUC is 0.5.
-

A tree fits its 400 training points exactly. Can it do worse than guessing the average?
On 500 noisy points from a course notebook, always guessing the training average misses 100 new points by 0.40 (average squared miss). A decision tree grown until it gets all 400 training points exactly right misses the same new points by 0.51, so it does worse than the average guess. R² scores a model against that guess, 1 minus its error divided by the average guess's error: 1 is perfect, 0 is no better, and the tree gets -0.30, while a straight line gets 0.39.
-

Precision 100%, recall 10%, average 55%. Is that a fair score?
Example: of 10 sick people, a model flags just 1, and that one really is sick. Its precision is 100% (1 of 1 flags) and its recall is 10% (1 of 10 found), so the plain average says 55% even though it misses 9 of the 10. The F1 score, 2 x precision x recall / (precision + recall), gives about 18%; a tomato sorter with precision 60% and recall 75% gets about 67%.
-

A program spots handwritten 4s with 88.56% accuracy. Is it any good?
A hand-written rule is tested on 10,000 handwritten digits, and 982 of them are 4s. It scores 88.56% accuracy but finds only 42 of the 982 fours. Answering "not a 4" to every digit would be right 9,018 times: 90.18%, higher than the rule. That lazy score is the baseline to beat.
-

Why might MAE be preferred over MSE?
Take an example where a model's guesses miss by 1, 1, 1, 1 and 10. MAE, the average size of the miss, is 2.8. MSE squares each miss first, so the 10 becomes 100 and MSE is 20.8; without the 10 both would be 1. MAE is less sensitive to outliers because it does not square the misses.
-

A model's two errors are +5 and -5. Its mean error is 0. Is it perfect?
In this example a model guesses 5 too high once and 5 too low once. Its mean error is (+5 - 5) / 2 = 0, because the two errors cancel out. Mean absolute error drops the signs first: (5 + 5) / 2 = 5, which shows how far off the model really is.
Decision trees
Entropy, information gain and where a tree splits.
-

What does entropy measure in a decision tree?
Entropy scores how mixed the labels in a group are. In a 14-day tennis dataset, the 4 overcast days all say yes (entropy 0), the 6 strong-wind days split 3 yes, 3 no (entropy 1), and all 14 days, 9 yes and 5 no, score 0.94. A decision tree looks for questions that leave groups with low entropy.
-

Tennis data, 14 days. Why does 'Outlook' give the biggest information gain?
14 days of tennis data: 9 yes, 5 no, a mix score (entropy) of 0.94. Splitting the days by outlook leaves the 4 overcast days all 'yes', a mix of 0, and drops the mix to 0.69, an information gain of 0.25. Humidity (0.15), wind (0.05) and temperature (0.03) drop it less, even though temperature also has 3 values.
-

A group is half yes, half no. What is its Gini impurity?
Gini impurity is 1 minus the squared share of each label. A group of 4 yes and 0 no scores 1 - 1² - 0² = 0, and a half-and-half group scores 1 - 0.5² - 0.5² = 0.5, the most a two-label group can reach. The 14 tennis days, 9 yes and 5 no, score 1 - (9/14)² - (5/14)² = 0.459.
-

Temperatures 40, 48, 60, 72, 80, 90. Where should a decision tree try to split?
Six days with temperatures 40, 48, 60, 72, 80 and 90. Any cut between two neighbouring values splits the days the same way, so a decision tree only needs to try one cut per gap, halfway between the neighbours: 44, 54, 66, 76 and 85. It tests each one and keeps the best; here that is 54.
-
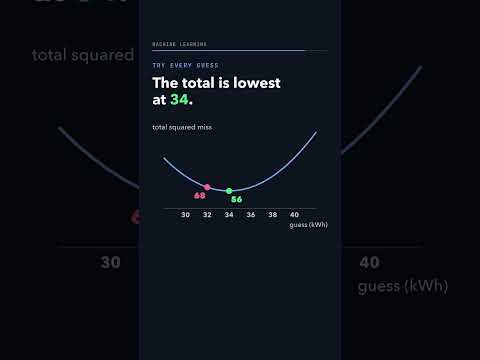
A regression tree leaf holds 30, 32 and 40 kWh. What does it predict?
Example: three rows of a campus energy table, 30, 32 and 40 kWh, end up in one leaf of a regression tree. Guessing 32 gives a total squared miss of 4 + 0 + 64 = 68; guessing 34 gives 16 + 4 + 36 = 56, the lowest of any guess. 34 is the mean, (30 + 32 + 40) / 3, so the leaf predicts the mean.
-

Does a deeper decision tree always do better on new data?
Trees of depth 1 to 7 are trained on 398 tumours from scikit-learn's breast cancer data and tested on 171 they never saw. Training accuracy climbs to 100% at depth 7, but accuracy on the new tumours peaks at 96.5% at depth 3 and falls to 92.4%. The deepest tree memorizes its training data: overfitting.
-

A fully grown decision tree is cut back to fewer leaves. Can it do better on new data?
On scikit-learn's breast cancer data, a decision tree grown until every training tumour is right has 16 leaves, 6 of them holding only 1 or 2 tumours, and gets 92.4% of new tumours right. Pruning it back to 7 leaves lowers training accuracy from 100% to 97.0% but raises accuracy on new tumours to 95.9%. How far to cut was picked by testing on held-out training data.
-

A tree with 3 levels of questions fits a sine wave. How many values can it predict?
A regression tree answers with the average of the points in each final group, its leaf. On 200 points of y = sin x, no question gives one value (error 0.50), one question at x = 3.14 gives 2 values, 0.63 and -0.63 (error 0.10), and 3 levels give 8 values, 2 times 2 times 2 (error 0.020). The fit is a staircase, and 4 levels give at most 16 steps.
Model fit and validation
Overfitting, underfitting and checking a model on data it has not seen.
-
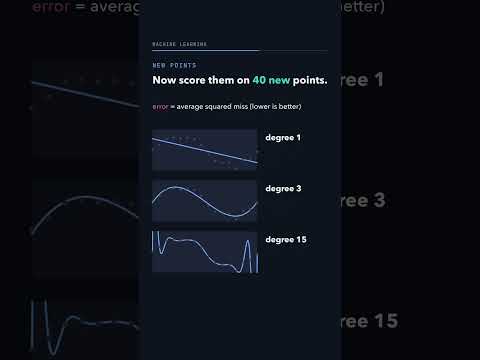
Three curves fit the same 16 points. Which will predict new points best?
Example: 16 points on a wave plus random noise, fitted with a straight line, a degree-3 curve and a degree-15 curve that passes through every point. On 40 new points the average squared error is 0.28 for the line, 0.07 for the smooth curve and 5.49 for the wiggly one. The line is too simple (underfitting); the wiggly curve copies the noise (overfitting).
-

Refit a line and a wiggly curve on 5 new samples. Whose predictions jump more?
Example: 5 samples of 16 points from the same wave plus random noise, each fitted with a straight line and a degree-15 curve. At x = 0.25, where the true value is 1.00, the line's 5 predictions spread over only 0.08 but average 0.36, while the curve's spread over 0.58 and average 0.83. The line has high bias; the curve has high variance.
-
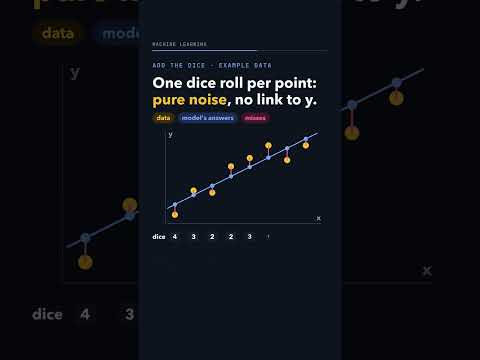
Add a column of dice rolls to a linear regression. Can its training error go up?
Example: a linear regression fits 8 points with a training error of 0.78. Adding a column of dice rolls, pure noise, drops its training error to 0.37, because the fit can always give the new column a weight of 0 and never does worse on its own data. On 8 new points the same change raises the error from 0.46 to 1.79, which is why input columns are chosen by how they do on new data.
-

California housing has 8 columns. Trying every set, how many models do you train?
Each of the 8 input columns of the California housing data is either in or out of a set, so there are 2 to the power 8 = 256 sets to train and score (one of them empty). With 20 columns that grows to 1,048,576. Forward selection adds the column that helps most, then the next, and trains only 8 + 7 + ... + 1 = 36 models, but it can miss the best set.
-

100 data points, 5-fold cross-validation. How many train the model each round?
Split 100 data points into 5 blocks of 20. In each of 5 rounds, one block is kept for testing and the model trains on the other 4 blocks: 4 x 20 = 80 points. Over the 5 rounds every point is tested exactly once, and the five test scores are averaged.
-

Rows sorted: 80 Yes, 20 No. Train on the first 80, test on the last 20. Will it work?
A dataset of 100 rows is sorted by class: the first 80 are Yes and the last 20 are No. Split it 80/20 without shuffling and the model trains on 80 Yes rows only, then is tested on 20 No rows, a class it never saw, and gets 0 of 20 right. After one random shuffle the same split gives 64 Yes and 16 No for training, and 16 Yes and 4 No for testing.
-

You scale with the mean of all the data, then cross-validate. Is the test score honest?
In this example 5 points (1, 3, 5, 7 and 24) go through 5-fold cross-validation, and this round 24 is the test point. The mean of all 5 points is 8, but the 4 training points alone give 4, so scaling with 8 lets the test point shape the training data. That is data leakage: compute the mean on the training folds only, then apply it to the test fold.
-

100 points, 10 positive, 5 random folds of 20. What is the chance a fold gets none?
Shuffle 100 points, 10 of them positive, into 5 folds of 20. A given fold gets no positives when all 20 of its picks are negatives: (90/100)(89/99)...(71/81) = 0.095, about 1 in 10, and the chance that at least one of the 5 folds gets none is 43%. Stratified cross-validation deals the positives and negatives separately, so every fold keeps the 10% share: 2 positives and 18 negatives.
Ensembles
Combining many models into one.
-

Draw 100 times from 100 items, putting each back. How many different items?
Draw 100 times from 100 items, putting each one back. Any one item is missed by all 100 draws with chance 0.99 to the power 100 = 0.366, so on average only 63.4 different items make it in; in one example draw, 64 did and 36 were never picked. This is a bootstrap sample, and bagging trains one model on each such sample and lets them vote.
-

3 models, each wrong 30% of the time, take a vote. How often is the vote wrong?
Three models are each wrong 30% of the time, with independent mistakes, and take a majority vote. The vote is wrong only when 2 or 3 of them are: 3 × 0.3 × 0.3 × 0.7 + 0.3 × 0.3 × 0.3 = 0.216, so 21.6%, and 16.3% with 5 models. If all three make the same mistakes, the vote stays at 30%, which is why a random forest trains each tree on different rows and features.
-

A model gets 2 of 10 points wrong. In boosting, which does the next one focus on?
Example: 10 points, each starting with weight 0.1. A one-split model gets 2 of them wrong, so AdaBoost doubles their weights, halves the rest and rescales: the 2 missed points now weigh 0.25 each, half of all the weight. The next model gets both of them right, and after three rounds the weighted vote gets all 10 points right.
-

In AdaBoost, a small model is wrong 90% of the time. How much say should it get?
AdaBoost lets many small models vote and gives each one a say. A model that is wrong 10% of the time gets 1.10, one wrong 30% of the time gets 0.42, and a coin flip, wrong 50% of the time, gets 0. A model that is wrong 90% of the time gets -1.10: its vote counts for the other side, and flipped it is right 90% of the time, as good as the 10% model.
-

A random forest split sees 2 of 4 measurements. How often is the best one hidden?
With 4 iris flower measurements and 2 picked at random for each split, there are 6 possible pairs, and 3 of them leave out any given measurement, so the best one is hidden half the time. On the 150 iris flowers, 100 trees that may use all 4 measurements all start with a petal question, while 100 trees that see 2 of 4 start with petal length 45 times, petal width 39 times and sepal length 16 times. Trees that differ make different mistakes, so the vote of the random forest cancels more of them.
Regression
Least squares, curves from new features, and penalties on big weights.
-

Line 1 passes through 3 of 4 points, line 2 through none. Which has less squared error?
Four points: (1, 1), (2, 2), (3, 3) and (4, 0). The line y = x passes through three of them but misses the last by 4, and 4 squared is 16. The least-squares line, intercept 2 and slope -0.2, misses all four by a little: 0.64 + 0.16 + 2.56 + 1.44 = 4.8.
-
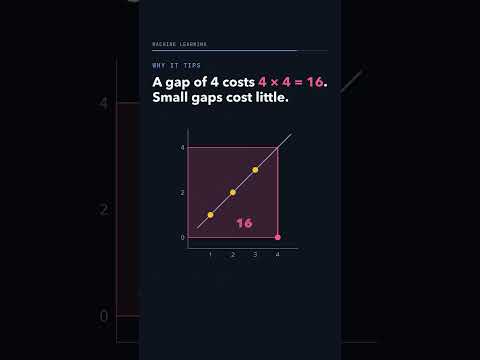
Four points lie on a rising line. Move one. Can the best-fit slope turn negative?
Four points (1, 1), (2, 2), (3, 3) and (4, 4) give a least-squares line with slope 1. Move only the last point to (4, 0) and the best-fit slope becomes -0.2, with intercept 2. Squared error explains it: keeping the old line would cost 4 x 4 = 16 for that one point, while the tilted line costs 4.8 in total.
-
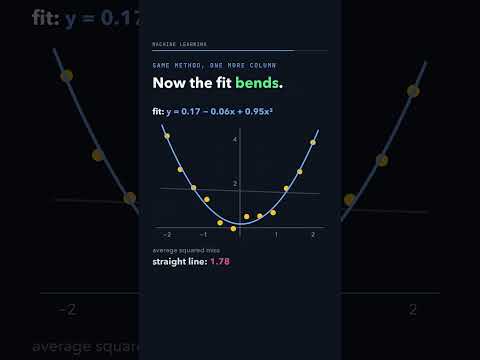
Linear regression fits straight lines. Can it fit a curve?
Twelve example points follow a curve. The best straight line misses them by an average squared miss of 1.78. Add x squared as one more input column (x = 2 gives 1, 2, 4) and the same least-squares fit bends into a parabola, with an average squared miss of 0.035.
-

Make a curve fit its training points worse on purpose. Can it do better on new points?
In this example a wiggly curve with 8 weights passes through all 8 training points (training error 0.00), but its error on 12 new points is 0.65 and its biggest weight is 19,011. Ridge regression adds a penalty on squared weights: with penalty strength 0.001 the training error rises to 0.10 while the error on new points falls to 0.15. Too big a penalty (strength 1) flattens the fit, so the strength is chosen by how well the model does on new data.
-
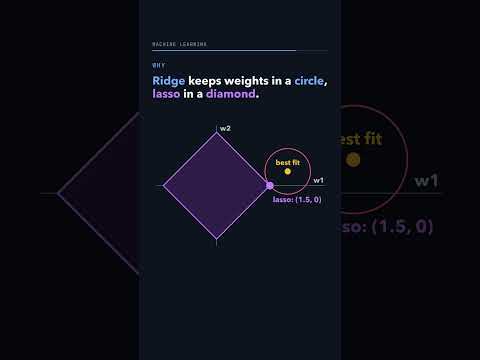
Ridge and lasso both shrink weights. Which one can make a weight exactly 0?
In this example the best fit has weights 2 and 0.4. With the same penalty strength of 4, ridge (a penalty on squared weights) shrinks them to 1 and 0.2, while lasso (a penalty on their sizes) gives 1.5 and exactly 0. Lasso keeps the weights inside a diamond whose corners sit on the axes, and the error rings first touch it at a corner, where one weight is 0; ridge's circle has no corners.
-

Sales 3, 5, 4, 6, 5, 7, 6, 8. A model uses the last 2 days. What does it predict next?
Example: daily sales of 3, 5, 4, 6, 5, 7, 6 and 8. Sliding a 3-day window along the series makes a table of 6 rows, each with the day before and yesterday as inputs and the next day as the target. A linear regression fits all 6 rows exactly with the rule today = the day before + 1, so it forecasts 6 + 1 = 7, while copying yesterday would say 8.
-

Four data sets share one best-fit line and the same average miss. Do they look alike?
Four data sets of 11 points each share the best-fit line y = 3 + 0.5x, an average y of 7.50, an average squared miss of 1.25 and a correlation of 0.82. Plotted, one is a noisy line, one a smooth curve that a parabola fits within 0.003, one a straight line with one far point, and in one a single point at x = 19 sets the slope. This is Anscombe's quartet: plot the data before you trust a fit.
-

Ridge with penalty 100 is fit to (1, 101) and (2, 102). What does it predict at x = 1?
The plain line y = 100 + x hits both points, but ridge regression with penalty 100 charges 100 times the squares of the intercept and the slope, 1,000,100 for that line. Ridge instead picks intercept 1.91 and slope 2.85, which misses by a lot but costs only 19,349, so it predicts 4.76 at x = 1 for a true value of 101. Leaving the intercept out of the charge gives 101.49 + 0.005x, which predicts 101.50 at both points.
Maths
The linear algebra behind the models.
-

u = (1, 2, 3), v = (1, 0, 2). What is the rank of the 3 by 3 matrix u vᵀ?
Example: u = (1, 2, 3) and v = (1, 0, 2). Multiplying every number in u by every number in v gives the 3 by 3 matrix u vᵀ with rows (1, 0, 2), (2, 0, 4) and (3, 0, 6). Every row is a multiple of (1, 0, 2), so there is only one independent row and the rank is 1, as it is for any u vᵀ built from two non-zero vectors.
-

Priya never rated Sholay. Can the other ratings predict hers?
Example: Arjun, Priya and Ravi rate Sholay, Swades and Interstellar, and one rating is missing. Give each person 2 numbers (Priya: 1, 2) and each movie 2 numbers (Sholay: 2, 0), so a rating is 1 × 2 + 2 × 0. These numbers give back all 8 known ratings and fill the blank with 2; writing the table as two small ones like this is matrix factorization.
Optimization
Gradient descent, the size of each step, and where it stops.
-

f(x) = x², start at x = 4, step size 0.1. Where is x after one gradient descent step?
Example: f(x) = x², starting at x = 4 with step size 0.1. The slope of x² at x is 2x, so at x = 4 it is 8; gradient descent steps against it: 4 − 0.1 × 8 = 3.2. Repeating the step gives 2.56, 2.048 and so on toward the bottom at 0, with smaller steps as the slope flattens.
-

f(x) = x², start at 4, step size 1.1. Does gradient descent reach the bottom?
Gradient descent on f(x) = x² moves x to x minus step size times the slope 2x. With step size 0.1 each step turns x into 0.8x, so from 4 it creeps down: 3.2, 2.56, 2.048. With step size 1.1 each step turns x into -1.2x, so it jumps across the bowl and lands farther out every time: -4.8, 5.76, -6.912. The step size, called the learning rate, decides which one happens.
-

Each step nudges a line toward one random point. Does the error drop every step?
Three points (1, 1), (2, 2) and (3, 3), a starting line y = 4 and step size 0.1. Using only (1, 1), the error on all three points falls from 4.67 to 1.75; the next step, using only (2, 2), raises it to 1.88. Over 20 random picks the error rose on 11 steps, while using all three points per step it fell on every one: stochastic gradient descent is cheap and noisy, and heads downhill on average.
-

Gradient descent stops where the slope is 0. Is that the lowest point?
On a single bowl, f(x) = x², gradient descent from x = 3 rolls down to x = 0, the lowest point. On the example curve f(x) = 3x⁴ + 4x³ − 12x², started at x = 2, it stops at x = 1 where f = −5, while the lowest point is −32 at x = −2. A curve is convex when a straight line between any two of its points never dips below it, and on a convex curve slope 0 always means the lowest point.
-
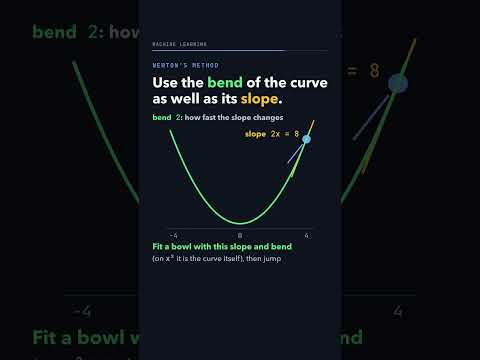
Gradient descent needs 27 steps down x² from x = 4. How many does Newton's method need?
On f(x) = x² from x = 4, gradient descent with step size 0.1 multiplies x by 0.8 each step and needs 27 steps to get within 0.01 of the bottom. Newton's method uses the bend of the curve as well as its slope: 4 minus slope 8 divided by bend 2 is 0, the bottom in one jump. On x⁴, which is not a bowl, each Newton jump only cuts x to two thirds.
Classification
Scores, probabilities, decision boundaries and the losses that train classifiers.
-

A model's score is 0. What probability does the sigmoid turn it into?
A model's score can be any number, but a probability has to sit between 0 and 1. The sigmoid, 1 / (1 + e^-z), squashes scores into that range: -3 becomes 0.047, 3 becomes 0.953, and 0 becomes exactly 0.5. Even a score of 10 only reaches 0.99995; the curve gets close to 0 and 1 but never touches them.
-

Logistic regression with two inputs: what shape is the border between yes and no?
In this example the score is x1 + x2 − 4 and the sigmoid turns it into a probability, from 0.02 at one corner of the grid to 0.98 at the other. The probability is exactly 0.5 where the score is 0, and x1 + x2 − 4 = 0 is a straight line. That line, the decision boundary, stays straight for any weights on x1 and x2.
-

The true class gets probability 0.01. Which loss punishes it more?
A loss is the penalty for one answer. If the model gives the true class probability p = 0.99, squared error (1 − p)² is 0.0001 and cross-entropy −ln p is 0.01, both tiny. At p = 0.01 squared error is only 0.98 and can never pass 1, while cross-entropy is 4.61 and keeps growing: 6.91 at p = 0.001.
-

Softmax turns the scores 2, 1, 0 into probabilities. What does the 0 class get?
Dividing each score by the total gives the class that scored 0 nothing, and turns a score of -1 into a negative share. Softmax instead takes e to each score (7.39, 2.72 and 1) and divides by their total, 11.11, giving 0.665, 0.245 and 0.090. Every class gets a positive share and the shares add to 1; the scores 2, 1, -1 give 0.71, 0.26 and 0.04.
-

A straight line sorts tomatoes from oranges. Add one huge orange. Does the cut move?
Seven fruits from a course notebook: tomatoes (0) at radius 0, 0.1, 0.2 and 0.3, oranges (1) at 0.6, 0.7 and 0.9. A straight line fit to the 0s and 1s crosses 0.5 at radius 0.45 and gets all 7 right. Add one easy orange at radius 2.5 and the line flattens (slope 1.47 to 0.45), the cut moves to 0.66, and the orange at 0.6 is called a tomato. Logistic regression's S-curve levels off at 1, so its border stays near 0.45 (0.44 after).
Neural networks
Neurons, layers, activations, backpropagation and filters.
-
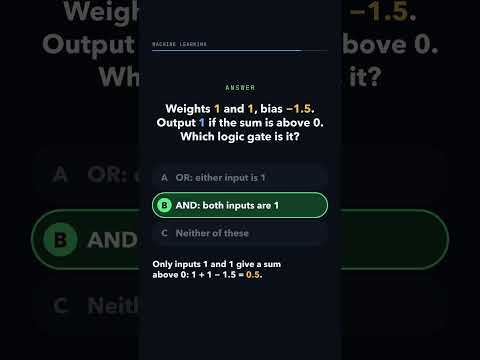
Weights 1 and 1, bias -1.5: which logic gate is this neuron?
A perceptron adds its inputs times their weights, plus a bias, and outputs 1 only if the sum is above 0. With weights 1 and 1 and bias -1.5, the sums for inputs 00, 01, 10 and 11 are -1.5, -0.5, -0.5 and 0.5, so only 1 and 1 gives a 1: an AND gate. Change the bias to -0.5 and the same neuron becomes OR.
-

Can one straight line put the blue points on one side and the amber on the other?
Four points follow XOR: the output is 1 when the two inputs differ, so the two blue points sit on opposite corners. Slide and turn a straight line however you like: the best tries still leave 2, 1 and 1 points on the wrong side, never 0. A perceptron, one neuron, draws exactly one straight line, so one perceptron cannot split XOR.
-

What is the fewest number of straight lines that separates XOR?
XOR outputs 1 when its two inputs differ, and any single straight line leaves at least one of its four points on the wrong side. Two lines do it: one neuron fires when input 1 + input 2 is above 0.5, a second when it is above 1.5, and the output is 1 when the first fires and the second does not. Two neurons side by side between the inputs and the output form a hidden layer.
-

Two layers with no activation, y = 3 · (2x). More powerful than one layer?
Stack two layers with no activation, one that doubles and one that triples: 3 · (2x) = 6x, which one layer can do alone. Add a number in each layer and 3 · (2x + 1) + 4 = 6x + 7, still one straight line. Put a ReLU between them, which turns negative numbers into 0, and the line gets a bend: that bend is what an activation function adds.
-

f = (x + y) × z at x = 2, y = 3, z = 4. Nudge x by 0.01: how much does f go up?
Example: f = (x + y) × z with x = 2, y = 3 and z = 4, so f = 20. Nudge x to 2.01: the sum becomes 5.01, and multiplying by 4 gives 20.04, so f goes up by 0.04 = 0.01 × 1 × 4. The chain rule multiplies the rates along the path, and backpropagation runs it backward through every step of a network.
-

784 inputs, 100 hidden units, 1 output. How many numbers does the network learn?
A 28 by 28 digit is 784 pixel values going into 100 hidden units and one output that answers "is it a 4?". Every connection has its own weight: 784 x 100 + 100 x 1 = 78,500. Each hidden unit and the output also adds a bias, 101 more, so the network learns 78,601 parameters.
-

A 5 by 5 filter slides over a 28 by 28 image. How big is the output?
A 5 by 5 filter slides over a 28 by 28 image one pixel at a time and gives one number at each stop. It fits in 28 - 5 + 1 = 24 spots across and 24 down, so the output is 24 by 24. Add a border of 2 zeros on each side (padding) and the image is 32 wide: 32 - 5 + 1 = 28, the same size as the input.
-
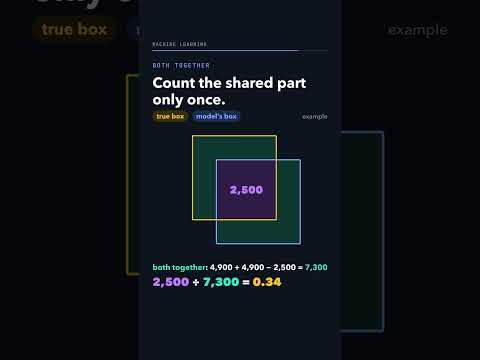
Two 70 x 70 boxes, one shifted 20 right and 20 down. How much do they overlap?
A true box and a detector's box are both 70 by 70 pixels, the second shifted 20 right and 20 down. They share 50 by 50 = 2,500 square pixels and together cover 4,900 + 4,900 - 2,500 = 7,300, so their intersection over union (IoU) is 2,500 / 7,300 = 0.34, below the usual 0.5 bar for a match. Shifted only 10 and 10, the IoU is 3,600 / 6,200 = 0.58, which counts.
-
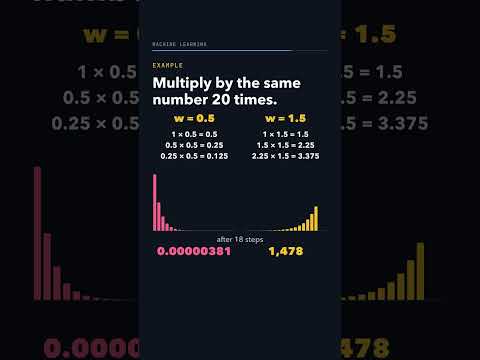
What happens to gradients in a simple RNN during backpropagation?
A simple RNN reads a sequence one step at a time and reuses the same weight at every step, so during backpropagation the gradient is multiplied by that weight once per step. Multiply by 0.5 twenty times and you get about 0.00000095; multiply by 1.5 twenty times and you get about 3,325. Below 1 the gradient vanishes, above 1 it explodes.
-

A language model reads "the cat sat on the". What does it output?
Example: after "the cat sat on the", a language model gives every word it knows a probability, such as mat 0.45, floor 0.25 and sofa 0.20, and they add up to 1. One word is picked by these chances and added to the text, then the model reads again: after "mat", a full stop gets 0.55. This loop is next-token prediction.
-

LeNet-5 has 61,706 weights. How many passes does backpropagation need for every slope?
Nudging one weight up and down and re-running a network gives that weight's slope, at 2 runs per weight: a 5-weight example needs 10 runs. LeNet-5, a classic digit reader, has 61,706 weights, so nudging needs 123,412 runs for every learning step. Backpropagation passes the slopes back through the network layer by layer, so one forward pass and one backward pass give all 61,706 slopes.
-
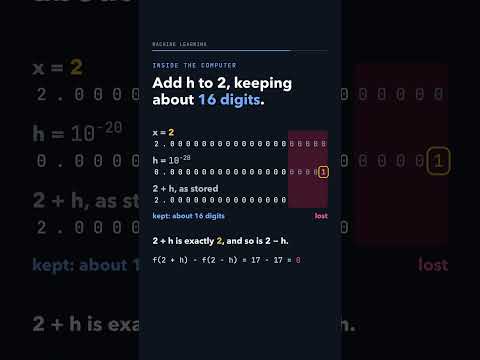
The slope of 3x² + 2x + 1 at x = 2 is 14. Nudge x by 10⁻²⁰: what slope do you get?
Estimating the slope of f(x) = 3x² + 2x + 1 at x = 2 (true value 14) by nudging x by h gives 14.000000000000004 for h = 0.1, but 13.9977 for h = 10⁻¹³ and 14.2109 for h = 10⁻¹⁵. A computer keeps about 16 significant digits, so with h = 10⁻²⁰ the sum 2 + h is stored as exactly 2. Then f(2 + h) - f(2 - h) = 17 - 17 = 0, and the estimated slope is 0.
-

LeNet-5 learns 61,706 numbers in 5 layers. Where are most of them?
LeNet-5, a classic digit reader, has 2 convolution layers and 3 fully connected layers. Each convolution filter reuses the same 5 x 5 weights at every spot in the image, so the two convolution layers need only 156 + 2,416 = 2,572 numbers (4.2%). The fully connected layers give every input and output pair its own weight: 48,120 + 10,164 + 850 = 59,134 of the 61,706 (95.8%). Done without sharing, the first layer alone would need 4,816,896 weights instead of 156.
-
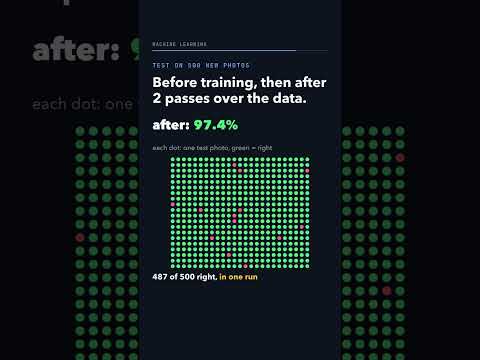
Freeze a trained image model, train only a 7,690-number last layer. Test accuracy?
A big image model trained on other pictures is frozen: it turns each CIFAR-10 photo into 768 numbers and is never changed. Only a new last layer of 768 x 10 + 10 = 7,690 numbers learns the 10 classes, over 2 passes of the 50,000 training photos. In one run of the course notebook it went from 9.4% right on 500 test photos (guessing gets 10%) to 97.4%, 487 of 500: that is transfer learning.
Other models
Nearest neighbours, naive Bayes and support vector machines.
-

New fruit: orange or apple? Its 3 nearest neighbours vote.
Example: known oranges and apples are plotted by redness and size, and a new fruit sits among them. Its closest neighbour, 1 grid square away, is a stray orange; the next two, 2 squares away, are apples. With k = 1 the new fruit is called an orange, but with k = 3 the vote is 2 to 1 for apple.
-

k-NN uses height (metres) and income (rupees). Which one decides who is nearest?
Example: a new person is 1.70 m tall and earns Rs 50,000. Person A is 1.72 m and Rs 54,000, person B is 1.98 m and Rs 50,500. The raw distances are 4,000 and 500, so B looks nearest and height adds less than 0.0001. Scale both features to 0 to 1 first and the distances become 0.09 and 0.56, so A is nearest.
-

A million stored points: must k-NN compare a new point with every one?
A k-d tree splits the stored points in half, then in half again, so a new point answers a few yes/no questions and is compared only with the points in its own box. With 10 example points it checks 2 distances instead of 10. With 1,000,000 random points, 15 questions lead to a box of at most 31 points, and in 1,000 tests it found the true nearest neighbour 891 times.
-

A ball just fits inside a cube. In 10 dimensions, how much of the cube does it fill?
In 2-D a circle that just fits inside a square covers 78.5% of it, and in 3-D a ball covers 52.4% of its cube. The share keeps falling as dimensions are added, down to 0.25% in 10-D: of 10,000 random points in a 10-D cube, only 25 land inside the ball. With many features almost every point sits far from the centre, so distances stop telling near from far.
-

Tennis on a sunny, cool, humid, windy day: what does naive Bayes predict?
In the 14-day tennis data they played on 9 days. For a new sunny, cool, humid and windy day, naive Bayes multiplies how common each answer is by one fraction per clue: yes gets 9/14 × 2/9 × 3/9 × 3/9 × 3/9 = 0.0053 and no gets 5/14 × 3/5 × 1/5 × 4/5 × 3/5 = 0.0206. No wins by about 4 times, even though no past day matched all four clues.
-

Point A is at (3, 0), point B at (2, 2). Which is nearer to (0, 0)?
Example: A at (3, 0) and B at (2, 2). In a straight line (Euclidean distance), A is 3 away and B is the square root of 8, 2.83, so B is nearer. In city blocks (Manhattan distance), adding the steps along each axis, A is 3 away and B is 2 + 2 = 4, so A is nearer. k-NN labels a point by its nearest neighbours, so the distance you choose can change them.
-

All 4 overcast days were "yes". What chance does naive Bayes give "no" to the next one?
In the 14-day tennis data, all 4 overcast days were "yes", so overcast appears on 0 of the 5 "no" days. For a new overcast, hot, humid, windy day, naive Bayes multiplies 5/14 by 0/5, 2/5, 4/5 and 3/5, so "no" gets 0%, even though the other three clues alone give "no" 81%. Add-one smoothing adds 1 to every count, overcast becomes 1/8 on "no" days, and "no" gets 44%.
-

Both lines make 0 mistakes. Which is safer for new points?
Example: two straight lines both split the blue points from the amber ones with no mistakes. Line A passes 0.5 away from its closest points; line B keeps them 1.41 away. That gap is the margin, and a support vector machine picks the line with the widest margin, so a new point near the blue ones still lands on the blue side.
-

Blue points sit inside a ring of amber. Can a straight line split them?
Example: 5 blue points sit inside a ring of 8 amber points. No straight line splits them in (x, y); the best one still gets 4 of 13 wrong. Add a new feature, x² + y², and the blue points score 0 or 1 while the amber ones score 8 or 9, so one cut at 4 splits them, which is a circle of radius 2 back in the plane.
-

One amber point sits among the blue ones. Must the dividing line twist to fit it?
Example: blue and amber points split cleanly by a straight line with a margin of 1.5, until one amber point sits among the blue ones. Keeping every point on its side twists the line and shrinks the margin to 0.34. A soft margin leaves that one point on the wrong side and keeps a margin of 2.05; the setting C, the price of each point on the wrong side, trades the two off (C = 100 versus C = 0.1 here).
-

An SVM's border sits at 0. Remove the blue point at 2. Where is the border now?
Example: blue points at 1 and 2, amber points at -1 and -2 on a line. A support vector machine (SVM) puts its border in the middle of the widest gap: at 0, with a gap of 1 on each side. Remove the blue point at 2, or move it to 10, and the border stays at 0, because only the closest points, 1 and -1 (the support vectors), hold it in place. Remove the point at 1 instead and the border moves to (2 + (-1)) / 2 = 0.5.
Unsupervised
Finding structure in data without labels.
-

Points 1, 2, 3, 7, 8, 9, centres at 0 and 5: where are they after one k-means step?
Example: six points at 1, 2, 3, 7, 8 and 9, and k-means starts two centres at 0 and 5. Each point joins its closest centre, and 3 is closer to 5, so the right centre takes 3, 7, 8 and 9 and moves to their average, 6.75, while the left one moves to 1.5. On the next step 3 switches back, the centres settle at 2 and 8, and nothing switches after that.
-

More centres always lower k-means' error. So is the k with the lowest error the best?
Example: 15 points in 3 clear groups. The k-means error (squared distances from each point to its centre, added up) is 298.7 with 1 centre, 134.5 with 2 and 12 with 3, then falls by less than 2 per extra centre, reaching 0 at k = 15 when every point is its own centre. So the lowest error is useless for choosing k; the elbow of the curve, here k = 3, marks the 3 groups.
-

Six points in one clump, three in another, one alone. Must the lone point join a group?
Example: six points in a tight clump near (1.5, 2), three near (10, 10) and one alone at (5, 5). DBSCAN calls a point crowded if at least 3 points, itself included, lie within 1.5 of it, and grows groups out from crowded points. The lone point's nearest neighbour is 3.61 away, so no group reaches it and it is left out as noise: DBSCAN finds 2 groups, of 6 and 3, without being told how many.
Reinforcement learning
Learning from rewards instead of labels.
-

No labels, only a reward at the end. What does the agent learn from?
Example: a robot in a 5-cell corridor moves left or right at random and gets +10 only when it reaches the flag; its first try takes 7 moves and only the last one is rewarded. Passing the reward back, each cell is worth 0.9 times the next one: 10, 9, 8.1 and 7.29, and moving toward the bigger value becomes its policy. That is reinforcement learning: no labels, just tries and rewards.
-

A car too weak to climb the hill pushes right all the time. How many steps to the flag?
In the MountainCar simulator, a car starts in a valley (position -0.45) with a flag on the right hilltop, and its engine is too weak to drive straight up. Pushing right every step, it rocks near the bottom and never reaches the flag, even in 10,000 steps. Pushing left for 50 steps first builds speed, and it reaches the flag at step 114 (in our run). The reward, -1 per step until the flag, gives no hint of this, so a learner has to explore moves that look wrong.