Short videos for ES 114 Probability, Statistics and Data Visualization at IIT Gandhinagar: one question per Short, answered in under a minute with a small example, in the same style as Machine learning in 1 minute.
53 Shorts so far, with more on the way.
53 Shorts
No matches
Try a broader word such as mean, chance or plot.
All Shorts
In course order.
-

Flip two fair coins. Which is more likely: two heads, or one of each?
Two fair coins can land in 4 equally likely ways: HH, HT, TH and TT. One head and one tail happens in 2 of them (50%), two heads in only 1 (25%). Listing every outcome first, the sample space, makes the count easy; with three coins, exactly two heads is 3 of 8.
-

How many events does one die roll have?
An event is any set of outcomes: "even" is the faces 2, 4 and 6, "a six" is just 6. Each of the 6 faces is either in an event or out of it, so a die has 2 x 2 x 2 x 2 x 2 x 2 = 64 events, counting "no face" and "all six". A coin, with 2 outcomes, has 4.
-

Roll a die 4 times. What is the chance of at least one six?
Adding 1/6 for each roll gives 4/6 = 67%, but the same shortcut gives 117% for 7 rolls, which is impossible. Of the 1,296 ways to roll a die 4 times, 625 have no six at all (5 x 5 x 5 x 5), so the chance of at least one six is 1 - 625/1,296 = 51.8%. That is the complement rule: count the "none" case and subtract.
-

10 people, and every pair shakes hands once. How many handshakes?
Each of the 10 people shakes 9 hands, and 10 x 9 = 90, but that counts every handshake twice: once for each person in it. So there are 90 / 2 = 45 handshakes, the number of pairs you can choose from 10 when order does not matter. 23 people make 253 pairs; 100 people make 4,950.
-

23 people in a room. What is the chance two share a birthday?
With 365 equally likely birthdays, 23 people make 23 x 22 / 2 = 253 pairs, and any pair could match. The chance that nobody matches is 365/365 x 364/365 x ... x 343/365 = 49.3%, so the chance of a shared birthday is 50.7%. With 50 people it is 97.0%.
-

You pick door 1 of 3. The host knows where the car is and opens door 3: a goat. Switch?
The car is behind door 1, 2 or 3, each with chance 1/3. Staying with door 1 wins only when the car was behind it (1 case of 3); in the other 2 cases the host must open the only other goat door, so switching wins 2/3 of the time. With 100 doors and 98 goats opened, switching wins 99 times in 100.
-

5% are sick. A test catches 90% of them, flags 5% of the rest. You test positive. Sick?
Picture 400 people: 5% are sick, so 20 are sick and 380 are healthy. The test catches 18 of the 20 sick people but also wrongly flags 19 of the 380 healthy ones, so only 18 of the 37 positives are sick: 48.6%, about half. The base rate, how common the illness is before testing, decides it: if 1% were sick the answer would be 15.4%; if 50% were sick, 94.7%.
-
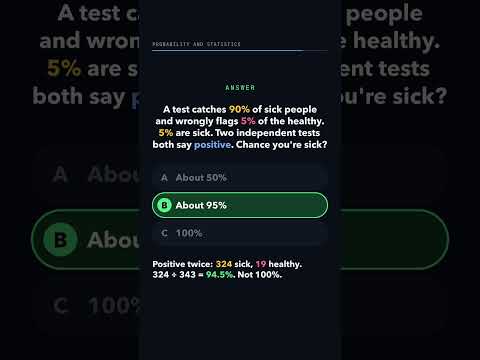
5% are sick. A test catches 90% of them and flags 5% of the rest. Positive twice. Sick?
Picture 8,000 people: 400 are sick and 7,600 are healthy. One positive test leaves 360 sick and 380 healthy people, so only 48.6% of positives are sick; a second, independent test leaves 324 sick and 19 healthy, so 324 of 343 = 94.5%. Each updated chance, the posterior, is the starting point for the next test: a third positive would give 99.7%, still not 100%.
-

A fair coin lands heads 5 times in a row. Chance the next flip is heads?
Six flips of a fair coin can land 64 equally likely ways, and only 2 of them start with five heads: HHHHHH and HHHHHT. One of those two ends in heads, so after five heads the next flip is heads 1 time in 2, 50%. Six heads from the start is rare (1 in 64), but the flips are independent: the coin does not remember its streak.
-

Teacher A has the higher pass rate in each section. Can teacher B be higher overall?
In this example, teacher A passes 9 of 10 students in the easy section (90%) and 30 of 60 in the hard one (50%); teacher B passes 50 of 60 (83.3%) and 4 of 10 (40%). A is higher in both sections, yet overall B passes 54 of 70 (77.1%) and A only 39 of 70 (55.7%), because most of A's students were in the hard section. This flip is Simpson's paradox: with the same mix of students, A comes out ahead again, 70% to 61.7%.
-

Roll two dice and add them. Which total comes up most often?
Two dice can land in 36 equally likely ways. A total of 7 comes up in 6 of them (16.7%), 10 in 3 (8.3%) and 12 in only 1 (2.8%), so 7 is the most likely total. The total is a random variable: a number worked out from each outcome.
-
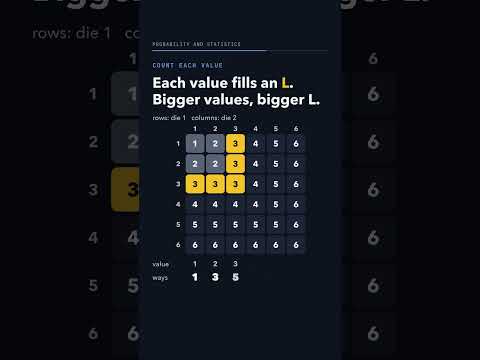
Roll two dice and keep the bigger one. Which value is most likely?
Of the 36 ways two dice can land, the bigger die is 6 in 11 of them (30.6%), 5 in 9, 4 in 7, 3 in 5, 2 in 3 and 1 in just 1. That list of chances, one for each value, is the PMF (probability mass function), and it adds up to 36/36 = 1. Keep the biggest of three dice and 6 comes up 91 times in 216 (42.1%).
-

A box has 10 eggs, each cracked with chance 10%. Most likely number of cracked eggs?
No cracked eggs needs all 10 to stay whole: 0.9 multiplied 10 times, 34.9%. Exactly one cracked egg is 0.1 x 0.9^9 = 3.87% for any given egg, and it can be any of the 10, so 38.7%, the most likely count; two cracked eggs (45 pairs) is 19.4%. This count of yes results in 10 tries with the same chance each is the binomial.
-

A help desk averages 6 calls an hour. Which is more likely: 5 calls or 6?
Calls that arrive at random, 6 an hour on average, follow the Poisson distribution: no calls at all has chance 0.25%, and each extra call multiplies the chance by 6 divided by the new count. The step from 5 calls to 6 is 6/6 = 1, so exactly 5 and exactly 6 calls are equally likely, 16.1% each. With an average of 4, 3 and 4 calls tie at 19.5%.
-

Roll a die until you get a six. Which number of rolls is most likely?
A six on the very first roll has chance 1/6 = 16.7%. Stopping on roll 2 needs a miss first, 5/6 x 1/6 = 13.9%, and every extra roll multiplies the chance by 5/6 again, so 6 rolls has only 6.7%. The count of tries until the first success is the geometric distribution: 1 roll is the most likely count, even though the average is 6 rolls.
-

Prices end in random paise. Round to the nearest rupee. Average size of the error?
Rounding to the nearest rupee moves a price by at most 50 paise: Rs 12.30 moves 30 paise, Rs 12.85 moves 15, Rs 12.50 moves the full 50. With random paise every error size from 0 to 50 is equally likely, a uniform spread, so the average size is the middle, 25 paise (20 example prices ending 00, 05, ..., 95 give 500 / 20 = 25). The signed error, up or down, averages 0.
-

Waits at a counter average 10 minutes (exponential). What share wait under 10?
With exponential waits that average 10 minutes, the share still waiting is multiplied by 0.368 (1/e) every 10 minutes: 36.8% still wait at 10 minutes, so about 63.2% are done in less than the average. Half are done by 6.9 minutes, but a few long waits (13.5% wait over 20 minutes) pull the average up to 10. A long tail on one side like this makes a spread skewed.
-

Marks follow a bell curve: average 70, spread (SD) 8. What share score above 86?
Measured with the standard deviation as a ruler, 86 is (86 - 70) / 8 = 2 SDs above the average. On any bell curve 95.4% of values lie within 2 SDs, so 4.6% lie outside, half on each side: about 2.3% score above 86. The same ruler gives 15.9% above 1 SD (78) and 0.13% above 3 SDs (94).
-

Can a probability density be bigger than 1?
For a random number from 0 to 2 with every value equally likely, the density is a flat line at height 0.5, and chances are areas under it: the whole area is 2 x 0.5 = 1, and 0.5 to 1 has chance 0.5 x 0.5 = 25%. Squeeze the range to 0 to 0.5 and the height must rise to 2 to keep the area at 1. A density is chance per unit of x, so it can pass 1; the areas, which are the chances, never do.
-

A loaded die: faces 1 to 4 take slices of 0 to 1 in order. Which face gets 0.45?
A loaded die shows faces 1 to 4 with chances 0.1, 0.2, 0.3 and 0.4. Laid end to end from 0 to 1, the slices end at the running totals 0.1, 0.3, 0.6 and 1, so a random number of 0.45 lands on face 3: past 0.3 but not past 0.6. That running total of the chances is the CDF, and it is how a computer turns one random number into a roll of the die.
-

10 people get their hats back, shuffled. On average, how many get their own?
With 3 people there are 6 ways to hand the hats back, with 3, 1, 1, 1, 0 and 0 matches: 6 matches in 6 ways, an average of 1. Each person gets their own hat with chance 1/3, and 1/3 + 1/3 + 1/3 = 1; with 10 people each has chance 1/10, and 10 x 1/10 = 1. Averages add even when the events are linked: this is linearity of expectation.
-

100 fair coin flips: win or lose Rs 100 each. How far from 0 do you typically end?
Each flip swings Rs 100 up or down, so its squared swing is 100 x 100 = 10,000. Over 100 independent flips the squared swings add to 1,000,000, and the square root gives a typical distance of Rs 1,000 (the standard deviation), not Rs 10,000, because wins and losses partly cancel. Only 8.0% of games end at exactly 0, and 72.9% end within Rs 1,000 of it.
-
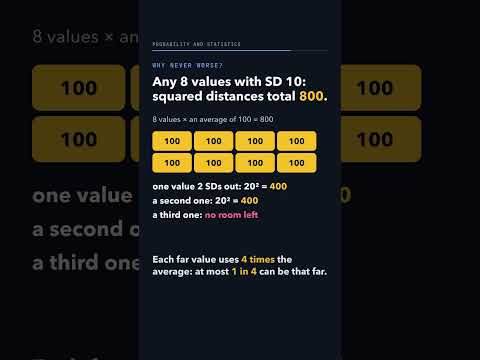
You know only a data set's mean and SD (spread). What share must lie within 2 SDs?
The SD squared is the average squared distance from the mean, so 8 values with SD 10 have squared distances that total 8 x 100 = 800. A value 2 SDs (20) out uses 20 x 20 = 400 of that, so at most 2 of the 8, or 1 in 4, can sit that far, and at least 75% lie within 2 SDs for any data. This is Chebyshev's inequality; the 95% figure holds only for bell-shaped data.
-

A dart lands at random in a 2 x 2 square. Chance it hits the circle that fits inside?
Every spot in the 2 x 2 square is equally likely, so each unit of area carries chance 1/4 (area 4 x 1/4 = 1). The circle that fits inside has radius 1 and area pi = 3.14, so the chance is 3.14 x 1/4 = 78.5%, and the four corners get 21.5%. The same flat joint density gives the triangle where x + y is at most 2, of area 2, a chance of 50%.
-

X is -2, -1, 0, 1 or 2, equally likely, and Y = X squared. What is their correlation?
The five points (-2, 4), (-1, 1), (0, 0), (1, 1) and (2, 4) form a perfect U around the mean point (0, 2). Multiplying each point's x gap by its y gap gives -4, +1, 0, -1 and +4, which add to 0, so the correlation is exactly 0 even though Y is fixed by X. Correlation only measures a straight-line trend: with X = 0, 1, 2 alone it is 0.96.
-

Ice-cream sales and sunburn cases correlate (0.99). Does ice cream cause sunburn?
In our 6-day example, ice creams sold (40 to 98) and sunburn cases (2 to 9) have a correlation of 0.99. Both follow the temperature, which rises from 25 to 40 C: it correlates 0.998 with sales and 0.995 with sunburns. A third thing that drives both is a confounder, and correlation alone cannot show what causes what.
-

Scale errors (independent): SD 3 g and SD 4 g. Add their readings: SD of the total?
In our example each scale is off by exactly its SD, up or down, so the four equally likely total errors are +7, -1, +1 and -7. Squared they are 49, 1, 1 and 49, which average 25, so the SD of the total is the square root of 25 = 5 g, the same as 3 x 3 + 4 x 4 = 9 + 16 = 25. Variances (SDs squared) add for independent errors; SDs do not, because the errors partly cancel.
-

20 above average on test 1. Tests correlate 0.5, same spread. Expected test 2 score?
In our example a score is skill plus luck, each +10 or -10: skill stays, luck is new on each test, and the two count equally, so the tests correlate 0.5. Scoring +20 on test 1 takes skill +10 and luck +10; on test 2 the new luck gives +20 or 0, an average of +10 = 0.5 x 20. This is regression to the mean: expected distance on test 2 = correlation x distance on test 1, for low scores too.
-

7 heads in 10 fair flips. After 1,000 more flips, what share of heads do you expect?
A fair coin has no memory, so the next 1,000 flips give about 500 heads, and the expected total is 7 + 500 = 507 heads of 1,010 flips, or 50.2%. The 2 heads above half never go away, but they become a smaller and smaller share: 70% after 10 flips, 51.8% after 110, 50.2% after 1,010. This is the law of large numbers: the share settles near 50% by dilution, not by correction.
-

A fair coin. Which is more likely to give 60% or more heads: 10 flips or 100 flips?
Ten flips of a fair coin have 1,024 equally likely orders, and 386 of them have 6 or more heads, so 60% or more heads comes up 37.7% of the time. With 100 flips, 60 or more heads has a chance of only 2.8%, because the share of heads bunches near 50%. Small samples swing more: 7 heads in 10 is common, 70 in 100 is rare.
-

One die: each face equally likely. Add up 10 dice. What shape do the totals make?
One die is flat: each face has 1 way in 6. Two dice already make a triangle, because a total of 7 can be made 6 ways out of 36 while 2 and 12 have 1 way each. With 10 dice there are 60,466,176 orders; a total of 35 can be made 4,395,456 ways (7.3%) and a total of 10 only 1 way, so the chart is a bell, as the central limit theorem says.
-

Run a random-number generator twice from the same seed. Same numbers?
A simple random-number generator makes each number from the last with one formula: next x = (1664525 x + 1013904223), keep the remainder after dividing by 2,147,483,647. Starting from seed 42 it gives 0.505, 0.177, 0.297, 0.369 on every run, while seed 7 gives a different list; NumPy's generator with seed 42 also repeats 0.774, 0.439, 0.859. Such pseudo-random numbers come from a formula yet look random: 1,000 of them land about 100 in each tenth of 0 to 1.
-

A poll of 100 people is good to about ±10 points. How many for ±5 points?
In our example a town is split exactly 50/50, and 96.5% of random polls of 100 people land between 40% and 60%, so the poll is good to about plus or minus 10 points. Polls of 200 people are good to about plus or minus 7 points, and polls of 400 people to plus or minus 5. The standard error, a poll's typical miss, shrinks with the square root of the number of people, so halving the margin takes 4 times the people.
-

A coin lands 7 heads in 10 flips. Which chance of heads makes that most likely?
If each flip is heads with chance p, the chance of exactly 7 heads in 10 is 120 x p^7 x (1 - p)^3, where 120 counts the orders of 7 heads and 3 tails. That gives 11.7% for p = 0.5, 26.7% for p = 0.7 and 5.7% for p = 0.9, and the curve over every p peaks at 0.7. This curve is the likelihood, the chance of the data under each guess; for 3 heads in 10 it peaks at 0.3.
-

Python multiplies 1,100 chances of 0.5 together. What does it get?
Each chance of 0.5 halves the running product: 0.5 to the 1,000 is still 9.3e-302, but Python's smallest positive number is about 5e-324, reached at 0.5 to the 1,074. The true value of 0.5 to the 1,100 is 7.4e-332, so Python rounds it to exactly 0. Adding logs instead gives 1,100 x log 0.5 = -762.5, an ordinary number, which is why libraries return log probabilities.
-

The new bar looks 3 times taller than the old one. How much did sales grow?
In our example sales go from 50 to 52, but the chart's axis starts at 49, so the bars are drawn 1 and 3 units tall and the new one looks 3 times taller. Redrawn from 0, the bars are 50 and 52 and the real growth is 2 / 50 = 4%. Bar lengths only compare fairly from a baseline of 0: 200 then 204 on an axis from 198 also looks 3 times taller, for 2% growth.
-

The line climbs the same height each year. Did it grow the same each year?
In our example users go from 10 to 100 to 1,000, drawn on a log-scale axis, so the line climbs the same height each year. Year 1 adds 90 users and year 2 adds 900, ten times as much: on a log scale equal steps mean equal ratios, here x10 each year. On the same kind of axis, doubling every year (1, 2, 4, 8, 16) is a straight line.
-

Class A: 66, 68, 70, 72, 74. Class B: 40, 45, 70, 95, 100. Which average is higher?
Both example classes add up to 350, so both averages are 350 / 5 = 70. Class A's scores sit 4, 2, 0, 2 and 4 points from 70, class B's sit 30, 25, 0, 25 and 30 points away, so the standard deviation is 2.8 points for A and 24.7 for B. A bar chart of the two averages shows two equal bars; a plot of every score shows the difference.
-
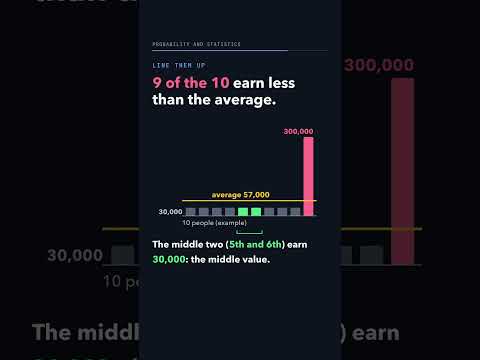
Nine earn Rs 30,000 each, one earns Rs 300,000. What is the average pay?
In our example the ten pays add up to 9 x 30,000 + 300,000 = 570,000, so the average is 570,000 / 10 = 57,000, and 9 of the 10 people earn less than that. Sorted, the middle two pays are both 30,000, so the median is 30,000. If the top pay were 3,000,000 the average would jump to 327,000 while the median would stay at 30,000.
-

Roll one die. What is the chance of an even number or a number above 3?
Even numbers are 3 of the 6 faces (2, 4, 6) and numbers above 3 are another 3 (4, 5, 6), so adding gives 3/6 + 3/6 = 100%, yet a 1 or a 3 is in neither. Faces 4 and 6 are in both and were counted twice, so take them away once: 3/6 + 3/6 - 2/6 = 4/6, about 67%. This is the union, A or B or both: add the two chances, then take away the overlap.
-

One die: "it shows 1" and "it shows 2" can never happen together. Are they independent?
Two events are independent when knowing one happened does not change the chance of the other. On one die the chance of a 2 is 1/6, but once you know the die shows 1 it drops to 0. Independent events would have a chance of both equal to 1/6 x 1/6 = 1/36, while here both at once is impossible, so 0. Events that cannot happen together, called mutually exclusive, rule each other out, so they are not independent.
-

50% of passwords are digits, 30% letters, 20% symbols. What share get hacked?
In our example 50% of passwords are digits only, 30% letters only and 20% use symbols, and 10%, 5% and 2% of each kind get hacked. Picture 1,000 passwords: 50 of the 500 digit passwords, 15 of the 300 letter ones and 4 of the 200 symbol ones get hacked, 69 in all, so 6.9%. That is 0.5 x 10% + 0.3 x 5% + 0.2 x 2%, the law of total probability: weight each group's rate by the group's share. Adding the rates gives 17% and their plain average 5.7%, and both are wrong.
-

5% are sick. Which test upgrade makes a positive result more trustworthy?
A test catches 90% of sick people and flags 5% of healthy ones, and 5% of people are sick. Picture 2,000 people: 100 are sick and 1,900 healthy, so 90 sick and 95 healthy people test positive, and only 90 of 185 positives (48.6%) are sick. Catching 99% of the sick adds 9 true positives and lifts that to 51.0%; flagging only 1% of the healthy cuts the false alarms from 95 to 19 and lifts it to 82.6%. Specificity, the share of healthy people the test clears, matters most when most people are healthy.
-

Pick a number from 0 to 1 at random and square it. Chance the square is below 0.25?
A computer picks a number between 0 and 1, every value equally likely, and squares it. The square is below 0.25 exactly when the number is below 0.5, because 0.5 x 0.5 = 0.25, so the chance is 50%; a million simulated numbers give 50.0%. The squares pile up near 0: the four quarters from 0 to 1 get 50%, 20.7%, 15.9% and 13.4% of them. A function of a random number, a transformation, has chances of its own: the square is below 0.5 with chance 70.7%, since that needs a number below 0.707.
-

10,000 bits, each wrong with chance 1 in 10,000. Chance the block has no errors?
In our example a block has 10,000 bits and each bit goes wrong with chance 1 in 10,000, so a block gets 10,000 x 1/10,000 = 1 error on average. For no errors every bit must be fine, and 0.9999 multiplied 10,000 times is 0.368, about 37% (the same as 1/e). This is the Poisson approximation: with many tries and a tiny chance each, the average alone sets the chances, here 36.8% for no errors, 36.8% for one, 18.4% for two, and 92.0% for two or fewer.
-

Normal or Laplace, same centre and same SD of 1: which gives more values beyond 3?
A normal curve and a sharp-peaked Laplace curve have the same centre and the same SD of 1 (we scale the Laplace to make its SD 1). More than 3 away from the centre, either side, the normal puts 0.27% of its values and the Laplace 1.44%, about 5.3 times more. More than 1 away the order flips: normal 31.7%, Laplace 24.3%. The SD alone does not tell you how heavy a curve's tails are, so check how often extreme values happen.
-

Heads (30%) wins Rs 10, tails loses Rs 5. After 100 plays, who comes out ahead?
In our example game heads comes up 30% of the time and wins Rs 10, while tails loses Rs 5. Each play is worth 0.3 x 10 - 0.7 x 5 = 3 - 3.5 = -0.5 rupees on average, so 100 plays cost the player about Rs 50 and the shop keeps it. Heads pays double, but tails comes up more than twice as often; to break even heads would need to come up 1 in 3 times. It is an average: 22.1% of players still get 34 or more heads and end ahead.
-

Roll a die and square the number. What is the average of the squares?
The six squares are 1, 4, 9, 16, 25 and 36, which add up to 91, so their average is 91 / 6 = 15.17. Squaring the average face instead gives 3.5 x 3.5 = 12.25, because the big faces 25 and 36 pull the average of the squares up. The gap, 15.17 - 12.25 = 2.92, is the die's variance: the average of the squared distances 6.25, 2.25, 0.25, 0.25, 2.25 and 6.25 from 3.5.
-

A coin lands heads 90% of the time. At least how many bits to store 1,000 flips?
A result with chance p carries log2(1/p) bits of surprise: a fair flip 1 bit, heads on our example coin (chance 0.9) 0.152 bits, and tails (chance 0.1) 3.32 bits. Weighted by how often each happens, that is 0.9 x 0.152 + 0.1 x 3.32 = 0.137 + 0.332 = 0.469 bits a flip, so 1,000 flips need about 469 bits on average, and no code can average fewer. This average surprise is the entropy: a fair coin needs 1,000 bits and a 99% coin only about 81.
-

X and Y are independent, each between 10 and 11. Cosine similarity 0.999. Are they linked?
Every pair (X, Y) sits near (10.5, 10.5), so the arrows from 0 to the points all point the same way and the cosine similarity is 110.25 / 110.33 = 0.999. Subtract the averages, 10.5 each, and the arrows point every way: the cosine of the centred numbers, which is the correlation, is 0. Between 0 and 1 the same kind of independent pair scores a cosine of 0.75, and again a correlation of 0.
-

Points spread 5 across and 2 up, tilted. How much spread can one line keep?
Our example points have a spread (variance) of 5 across and 2 up, 7 in total, and they rise together (covariance 2), so the cloud tilts. Keeping only each point's place along a flat line keeps a spread of 5; as the line turns, the spread it keeps rises to 6 at 26.6 degrees up and falls to 2 when the line points straight up. That best line is the principal component: one number per point keeps 6 of the 7, about 86%, and the line at right angles holds the other 1.
-

Next-letter weights add to 0.8. Scaled to add to 1, how often is "e" picked?
In our example a program weighs the letter after "appl": e 0.3, i 0.2, a 0.1, o 0.1, u 0.05 and end 0.05, which add to only 0.8. To make them add to 1 it divides each weight by the total, so every piece grows by the same factor 1 / 0.8 = 1.25 and e becomes 0.3 / 0.8 = 0.375, picked 37.5% of the time. The other shares become 25%, 12.5%, 12.5%, 6.25% and 6.25%; multiplying by 0.8 instead would shrink e to 24%.
-

A box plot of 20 marks. How many of the 20 marks lie inside the box?
Our 20 example marks, sorted, run from 31 to 94. With NumPy's default percentile rule, which Matplotlib's box plot uses, the first quartile is 49.5 (between 48 and 50) and the third is 68.5 (between 68 and 70), so the box holds the 10 marks from 50 to 68: the middle half. Each whisker holds 5 marks, so the long right whisker from 70 to 94 shows spread, not a bigger count.